

See where your @tastytrade options actually stand. Positions, rolls & real P&L. Try it for 30 days free. No card required.
Joined July 2026
- Tweets111
- Following51
- Followers16
- Likes72




Pinned Tweet
Serious question for options traders.
Can TradeZella, TradesViz, or TraderSync tell you which of your strategies is actually making money? Do any of them know an iron condor from a butterfly? A jade lizard from a strangle?
They track trades. OptionLedger tracks strategies.
Still glued to the screen watching your positions?
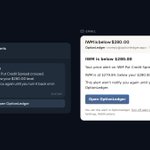
New in OptionLedger: price alerts that reach you. Set an alert level on a position, close the app, and get an email or a Telegram message when the price crosses it. Quiet hours too.
Set it and walk away.

17
Which numbers do you want on every row?
New in OptionLedger: choose your own columns. Click Columns and drag in Delta, Theta, Days open, Max Profit, Break-even and more. Drag headers to rearrange. Hide what you don't use.
Options, Equities and the Ledger pages.

1
1
47
Pop quiz.
Buy a put. Sell a put below it. Sell two more below that.
What's it called? And has it made you money this year?
OptionLedger answers both. Your trade journal is still waiting for you to tag it.
19
What does a volatility spike cost your account?
New in OptionLedger: Exposure now shows gamma, vega and theta next to delta. Same chart, by underlying, strategy or account.
One number: -$681 for every point IV rises.

1
29
Which chart do you check first?
New in OptionLedger: drag and drop on the Dashboard. Grab a chart by the grip in its corner and drop it where you want it. The order saves for next time.
Put that one at the top.
13
How much does your account move when the market does?
New in OptionLedger: Exposure. Every position's delta in SPY terms, weighted by tastytrade's beta. So SGOV counts as zero and /ES counts in full.
One number: +162 SPY deltas is about $1,247 for each 1% SPY moves.

11
Where is your buying power being used?
New in OptionLedger: a Treemap view on the Allocation chart. Each block is sized by the buying power it uses, then split into the symbols inside it.
The big ones stand out at a glance.

28
Did your account grow, or did you just add money?
New in OptionLedger: Net Liq. Your account value day by day, since each account opened. Deposits and withdrawals are marked and kept out of your gain.
Start + deposits and withdrawals + gain = today. It all adds up.

18
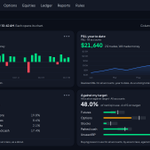
New in OptionLedger: a Dashboard.
Save any chart from Reports and pin it. P&L last 30 days, year to date, buying power by asset class, your allocation against target. The numbers you check every day, on one page.
Pick 1 to 4 columns. Each chart opens in full with one click.

22
See where your buying power actually goes.
The new Allocation tab in OptionLedger Reports pulls your BP live from tastytrade, by symbol, strategy or risk type.
SGOV counts as BP used, but it isn't risk. So it's set apart - you see your real trading BP and what you can deploy.

21

OptionLedger is live! 🚀
Connect tastytrade and see your P&L by strategy, not by leg. Iron condors, strangles, spreads. Every roll linked back to where it started, so you finally know what a trade really made.
30 days free. Link in bio.

14
If you're still using spreadsheets to track your results on tastytrade, do yourself a favor and try a trade journal built for options from the ground up.
OptionLedger was built exclusively for tastytrade and totally focused on options.
OptionLedger launches October 1. 🎉
The beta is done. It's ready.
If you trade options on tastytrade, it connects to your account and rebuilds your trading into something you can actually read:
• Raw fills grouped into real positions
• Strategies detected automatically. Verticals, iron condors, calendars, strangles.
• Every roll followed as one chain, with running P&L. Roll six times and it's one story, not six disconnected trades.
• Live P&L, payoff charts, per-strategy performance
It's still free until October 1. Join this week and you're free now, plus 30 more days when billing starts. No credit card either way.
After that: $19/month, billed annually at $228. Or $29 month to month.
Official tastytrade OAuth, read-only. It reads your trades. It can never place one.
optionledger.app

1
20
Want to look before connecting anything? The live demo runs on a real account's data, no signup:
app.optionledger.app/demo
Full pricing details here:
optionledger.app/pricing
9
Your positions tag themselves now.
0DTE. Weekly. Credit. Debit. Futures. Rolled. OptionLedger reads all of it off the fills, so the filters are live the moment a trade imports.
No tagging, no upkeep. Your own tags sit right next to them in the same picker.
Free during beta.
27
Another serious question for options traders.
Roll a short put four times. Ask TradeZella, TradesViz or TraderSync what that position has made. You get four closed trades and a new one, each starting at zero.
They track fills. OptionLedger tracks the chain.

14
Is it showing a loss? Sure. But OptionLedger shows why. It's not in trouble, it just needs more time.

33
Open beta for OptionLedger is live. I'm capping it at the first couple dozen accounts, and it's free the whole time the beta runs.


