

University of California Extension Specialist. Supporting sustainable agriculture through research, extension and outreach.
- Tweets214
- Following238
- Followers306
- Likes145


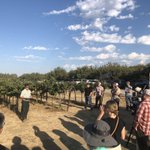




ALT Dr. Tom Gordon, Distinguished Professor Emeritus at the University of California, Davis


ALT Heatmap of virtual taxa counts of huanglongbing (HLB) disease severity from Florida samples following Deseq2 variance stabilization transformation (VST). Each row represents a single root sample, and each column represents a unique virtual taxon. For clarity, only virtual taxa that occurred in three or more samples are displayed. An asterisk (*) depicts virtual taxa differentially abundant between geographical locations per DESeq2 Wald's test. The column annotation bar graph depicts the prevalence (number of unique samples) of the virtual taxa. Row annotations show which samples belong to each disease rating severity and the bar graph shows the number of unique amplicon sequence variants (ASVs) associated with each sample. The Venn diagram heatmap with yellow rectangles shows which taxa were found in at least 10% of samples from each disease severity. Dk = Dominikia, Rz = Rhizophagus, Sg = Septoglomus, and Uk = unknown.


