

The only Python IDE you need. Built by @JetBrains, part of @JetBrainsData
- Tweets8K
- Following28
- Followers71.7K
- Likes4.9K
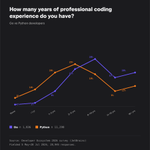









ALT Chart titled "How many years of professional coding experience do you have?" comparing Go (blue line) and Python (orange line) developers. X-axis shows experience ranges from under 1 year to more than 16 years. Y-axis shows percentages from 0% to 40%. Python developers have higher percentages in the 2-5 and under 1 year ranges, peaking at 29%. Go developers peak at 27% in the 6-10 years range. Data sourced from JetBrains Developer Ecosystem 2026 survey with 40,281 respondents.


ALT Graph comparing annual salaries of Go and Python developers in 13 brackets, from less than $20K to more than $500K. It shows Go developers (in blue) predominantly in higher salary brackets, while Python developers (in orange) are concentrated in mid-range brackets. The highest peaks are 12% for Go in the $100K-$120K range and 9% for Python in the $60K-$80K range. Data from Developer Ecosystem 2026 survey by JetBrains.


ALT Blue and green gradient background with text: "JETBRAINS IDEs | PyCharm" at the top and "Python vs Go: A Practical Comparison for Developers" prominently displayed in the center.


ALT Python 3.15 is here!


