

That which seems to be wealth may in verity be only the gilded index of far-reaching ruin. Draw your own conclusions.
Joined December 2013
- Tweets36.2K
- Following50
- Followers6.7K
- Likes1.1K


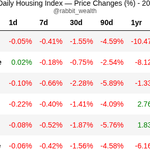
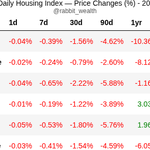
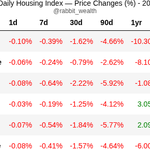
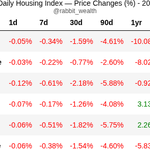



A look at Sydney auction clearance rate seasonality - December is typically the weakest month when sellers rush to auction before Christmas while buyers wind down. Buyers usually return in February before new listings build up.

The mechanical relationship between property auction clearance rates and prices gives us a short window into where the Cotality index is likely to go in the next 2 months - on that measure Sydney property prices will maintain its current trajectory in the short term

28
1,975
📉 2026-11-14: A year ago Perth ran at +34.1%/yr. Today it's -23.2%/yr, a 57-point swing and the biggest on the board, with Brisbane close behind at -52pp. Melbourne's swing is just -17pp, the smallest turn of any capital.


📉 2026-11-13: Adelaide has closed lower 22 days straight, matching its longest run of the year. Melbourne broke ranks with a +0.02% day, the only green on the board. Perth's slide stretches to 155 days, also a 365d record.


📉 2026-11-12: Composite -1.54% on the month, pace stuck at -18.5%/yr (-0.1pp) and at its 365d low. Underneath, Perth (+1.4pp), Melbourne (+1.0pp) and Adelaide (+0.9pp) are easing, but Brisbane's -3.1pp drag cancels them out.


📉 2026-11-11: Calendar 2026 so far: Sydney -10.26%, Melbourne -8.01%, Brisbane -3.54%, Perth -2.05%. Adelaide clings on at +0.13%, the only capital still ahead on the year, after Q4 has already shaved 1.49% off it.


📉 2026-11-10: 30d board reshuffle on the month. Adelaide climbs past Sydney into 2nd at -15.1%/yr, and Perth hands the cellar to Brisbane. Brisbane's slide is picking up speed (-2.6pp), now -26.1%/yr vs -22.0% a month ago.


Over in Brisbane - Exceptionally cheap body corporate: $740 a quarter.
Exceptionally expensive three quarters: -$108k.
Jan 2026: $865k → Oct 2026: $757k
Getting into Brisbane on the top floor, at top of the market.

📉 2026-11-09: A $1M Sydney home bought at the March peak is worth $893,909 today, 235 days on. That 10.6% fall takes +11.9% to undo. Adelaide's June-peak buyer is down $48k, the lightest hit on the board.


Record number of homes for sale in Sydney, 7% above previous record from Nov 2018. The pile up is from buyers not turning up, not sellers rushing in - new listings are -15% yoy, stale stock is +49% yoy. h/t @SQMResearch .


MEDIA RELEASE:
Total Australian property listings reach 300,000 residential properties.
Melbourne (51,264) and Canberra (5,548) listings both reached the highest levels on SQM records.
New listings increased 8.0% nationally but remain 1.2% lower year-on-year.
Old listings rose 6.3% nationally and are now 16.2% higher than October 2025.
Distressed listings increased a further 10.2% to 5,368 properties, the highest level since late 2024, and are now 42.3% higher year-on-year, with every state and territory above October 2025 levels.
sqmresearch.com.au/uploads/T…
rabbittail retweeted

MEDIA RELEASE:
Total Australian property listings reach 300,000 residential properties.
Melbourne (51,264) and Canberra (5,548) listings both reached the highest levels on SQM records.
New listings increased 8.0% nationally but remain 1.2% lower year-on-year.
Old listings rose 6.3% nationally and are now 16.2% higher than October 2025.
Distressed listings increased a further 10.2% to 5,368 properties, the highest level since late 2024, and are now 42.3% higher year-on-year, with every state and territory above October 2025 levels.
sqmresearch.com.au/uploads/T…
📉 2026-11-08: Momentum is pinned to the floor. Melbourne leads at just 13/100 and Adelaide sits at 6, while Sydney, Brisbane and Perth are all at 0. Brisbane's slide is picking up speed at -1.5pp, against +0.1pp a month ago, now -24.6%/yr.


📉 2026-11-07: Perth has closed lower 149 days straight, its longest run of the year and still extending. Brisbane is 37 days into its own slide, well short of its 68-day record, with the decline deepening (-1.1pp) at -24.2%/yr.


📉 2026-11-06: Melbourne's past week did more damage than its month, at -11.1%/yr over 7 days vs -9.5% across 30. Brisbane's week ran hotter too, at -25.7% vs -23.3%. Sydney had the quiet week in a busier month, at -16.8% vs -18.5%.


📉 2026-11-05: Split the board at the -17.6%/yr composite. Three capitals are falling faster: Brisbane -23.0%, Perth -20.1% and Sydney -18.7%. Two are falling slower: Adelaide -14.3% and Melbourne -9.2%. That is a 13.8-point spread top to bottom.


📉 2026-11-04: Brisbane just printed a fresh 365-day low, its first new trough in 364 days, 8.1% off peak. Steepest 30d pace on the board at -23.5%/yr, still deepening (-0.6pp) but more slowly than a month ago (-1.3pp).


📉 2026-11-03: Adelaide's turnaround is the biggest on the board. Acceleration is +0.5pp vs -8.0pp a month ago, and its 30d pace recovered to -15.4%/yr from -20.5%. Sydney lost its edge, going from +1.4pp to -0.4pp, a flat slide at -18.9%/yr.


I see a lot of comparisons of the current property downturn with previous downturns.
For Sydney, in nominal terms this is the sharpest downturn since 1990, although not (yet) as deep as 2017-19...but (1/3)

in real terms, the current downturn is, in fact, a continuation of the downturn that started in 2021 and never reclaimed the peak. Persistent inflation means we are now in the second leg of a 5-year downturn, and it's the most vicious second leg of any since 1990.

1
18
1,440