

Delivering multi-asset research & strategy https://xitter.cf/t.co/FzBZGI5oDM
New York
Joined November 2012
- Tweets2.9K
- Following216
- Followers4K
- Likes2.4K




Pinned Tweet
Rationale is my research service that provides actionable trade ideas and in-depth market analysis across equities, FX, futures, ETFs, and crypto.📊📉
Subscribe now for exclusive trade ideas👇
rationaletrading.com/

Semiconductors are the center of attention for the AI cycle. I’ll try to tune out the noise and follow the price action on this chart.
The information I am willing to focus on:
1) $SMH - VanEck Semiconductor ETF daily chart is consolidating in a range and may form a symmetrical triangle.
2) It is currently finding support at the lower boundary, which lines up with the 200 day EMA, the main trend setter for me.


$KCCA (KraneShares California Carbon Allowance Strategy ETF) tracks California carbon allowance futures.
Weekly chart formed 20 month-long ascending traingle chart pattern acting as a reversal after aprior downtrend.
California is cutting the number of carbon allowances available by 11% per year through 2030, up from 4% before. Fewer permits, same number of emitters who legally need them. Less supply and ongoing demand could support higher futures prices over time. The triangle may be pricing that in.

$US10Y real yield weekly update. After the symmetrical triangle breakout, the yield pulled back and is finding support at the pattern high. If this continues, pressure on precious metals and long duration equities would increase.

Update on the US10Y real rate weekly chart!
For those interested in macro dynamics, understanding how real rates impact other financial instruments is crucial. Real rates are one of the most important macro variables to monitor. They represent the return an investor actually receives after adjusting for inflation, making them the primary driver of capital allocation decisions across asset classes.
To understand the relationship between yields and inflation expectations check the quoted post.

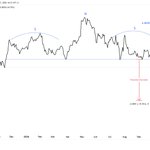
$IJH - iShares Core S&P Mid-Cap ETF daily chart formed a 4 month-long H&S top.
If it breaks out above the right shoulder (74.35), the pattern acts as a top failure. If it breaks below the neckline (71.55), the pattern acts as a top reversal.

$RDVY - First Trust Rising Dividend Achievers ETF daily chart formed a 3 month-long H&S top.
If it breaks out above the right shoulder (80.43), the pattern acts as a top failure. If it breaks below the neckline (78.44), the pattern acts as a top reversal.


Trade Ideas Equities: SIG(NYSE), LW(NYSE), OGS(NYSE), DIN(NYSE), CORZ(NASDAQ), VFC(NYSE), CPA(NYSE)
rationaletrading.com/p/trade…


Trade Ideas Equities: GOLD(NYSE), WWW(NYSE), ARW(NYSE), HUBS(NYSE), HPE(NYSE)
rationaletrading.com/p/trade…


Trade Ideas Equities: MA(NYSE), NU(NYSE), FANG(NASDAQ), SNX(NYSE)
open.substack.com/pub/roygul…


Trade Ideas Equities: W(NYSE), FDS(NYSE), URBN(NASDAQ), PACB(NASDAQ)
rationaletrading.com/p/trade…
