
An ecohydrologist studies nitrogen, forest fire, and beetles at University of Nevada, Reno
Reno
Joined September 2011
- Tweets310
- Following1.4K
- Followers337
- Likes7.2K





Ning Ren retweeted

Looking to create stunning, data-rich maps in R? The tidyterra package makes it simple to integrate spatial data with ggplot2, bringing the power of the tidyverse to geospatial analysis. With tidyterra, you can work with spatial data just like any other data set in ggplot2.
✔️ Ease of Use: Simplifies map creation by integrating with ggplot2, using familiar functions and syntax, which reduces the complexity of working with spatial data.
✔️ Flexible Visualizations: Supports a variety of geospatial formats, allowing you to combine spatial data with other data sets, and work seamlessly with both raster and vector data.
✔️ Efficient Data Handling: Leverages dplyr-like functions for filtering, summarizing, and joining, which streamlines data processing and enables smooth integration between spatial and non-spatial data.
✔️ Beautiful Maps: Create detailed, customizable maps with less code and more flexibility, using the grammar of graphics you already know from ggplot2.
The visualizations shown here are taken from the package website and demonstrate how tidyterra simplifies creating detailed maps using ggplot2: dieghernan.github.io/tidyter…
If you’d like to learn more about ggplot2 and how to create stunning visualizations, check out my online course on “Data Visualization in R Using ggplot2 & Friends!”
Click this link for detailed information: statisticsglobe.com/online-c…
#RStats #DataVisualization #R4DS #database #DataAnalytics #DataViz #ggplot2 #Statistics

Ning Ren retweeted

RESEARCH ARTICLE
Stomatal Decoupling From Photosynthesis Under High Temperatures Is Consistent With Stomatal Optimisation
🔗 buff.ly/jDmsvIQ

Ning Ren retweeted
Working with environmental data often means searching through multiple sources and handling messy file formats.
The forestdata R package solves this by bringing global forest, land-use, and canopy height datasets directly into R. It makes exploring large-scale ecological data much simpler and fully integrated into your workflow.
With forestdata you can:
🔹 Access global canopy height maps
🔹 Explore tree allometry and crown architecture databases
🔹 Work with forest inventories and land cover datasets
🔹 Load everything in tidy or spatial formats for analysis and visualization
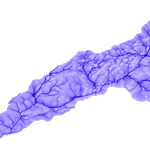
This opens up new opportunities to study forests, land use, and environmental change, all within R. The visualization below shows an example created with the forestdata R package by Adrián Cidre González. You can find more details on the package website: cidree.github.io/forestdata
For more practical insights on R, Python, statistics, and data science, check out my newsletter.
More information: statisticsglobe.com/newslett…
#RStats #datastructure #statisticians #DataAnalytics

Ning Ren retweeted
RESEARCH ARTICLE
Individual Trees Respond to 40 Years of Climate Change Through Leaf Functional Trait Acclimation
🔗 buff.ly/Dgk1jId

Ning Ren retweeted

💥NEW & Exciting in 💥
GLOBAL CHANGE BIOLOGY
Clockwise or Counterclockwise: Hysteresis in the Response of #Ecosystem #Respiration to Temperature
doi.org/10.1111/gcb.71044
Fundamental to understand #Temperature effects on #CO2 fluxes
#soil #Roots #Q10 #ClimateChange #GlobalWarming

Ning Ren retweeted

Just stopping by to drop a new commentary with @YangOu363 in @ScienceMagazine recounting the history of stabilization wedges and featuring the modern updates to the wedges by Johnson and @iain_staffell.
my commentary: science.org/doi/10.1126/scie…
Wedge 2026: science.org/doi/10.1126/scie…

Ning Ren retweeted


ALT library(tidyplots) study |> tidyplot(x = treatment, y = score, color = treatment) |> add_violin() |> add_data_points_beeswarm(white_border = TRUE) |> rename_x_axis_levels(new_names = c( "A" = "Dog", "B" = "Cat", "C" = "Hamster", "D" = "Dinosaur"))





Ning Ren retweeted

New online! Impacts of rising atmospheric dryness on terrestrial ecosystem carbon cycle bit.ly/46HBAE4

Ning Ren retweeted
OPINION
Ecosystem Phenology: Integrating Traits and Processes Beyond Observable Events
🔗 buff.ly/62Ij1xB


Ning Ren retweeted

Calculus - 1
Full Playlist for calculus on YouTube, for those who deep dive into mathematics and calculus.
Link in comments 😎👇

Ning Ren retweeted

🌍 Just wrapped up my course "Unlock the Power of Mapping in R" at CEU: what an amazing journey! Nearly 30 talented Master's students, many new to programming, mastered R, spatial analysis, and ggplot2 to tackle real-world political issues.
Their final projects mapped everything from elections and conflict zones to economic development, truly remarkable! Check out some of their fantastic maps below!
💡 Want your team or university to master these valuable skills? I offer customized, interactive workshops tailored specifically to your needs.
🚀 I'm also launching a live, Zoom-based version of this course soon. Interested? Drop a comment or DM me. I’d love to connect!
#GIS #RStats #SpatialAnalysis #DataVisualization #Mapping #ProfessionalTraining #HigherEd #CEU #MilosMakesMaps


Ning Ren retweeted
"Statistics Fundamentals" by Josh Starmer
best and most hands-on course on YouTube for statistics for machine learning.


Ning Ren retweeted

📢 Big news for inequality researchers & policy-makers!
@UNUWIDER has just released a major update to the World Income Inequality Database (WIID) — the most comprehensive source of global income inequality data.
wider.unu.edu/news/unu-wider…
🧵👇

Ning Ren retweeted
You've heard of the studies where they give the same dataset/research question to a bunch of researchers and they tend to get different answers, right?
Why is that?
This new working paper shows that it has a lot to do with data cleaning.
This is consistent with Gelman's "garden of forking paths" analogy. Small researcher coding decisions greatly influence results, often without being explicitly acknowledged.


Ning Ren retweeted

这几天陆续在读一个无意中发现的宝藏博客。老哥学术背景很扎实,笔耕不辍,文风精炼且不失温度;内容也很丰富,概率论,矩阵理论,ML,统计学派,贝叶斯派都有,还有一些交易相关的 VIX,平值期权什么的,我强推进必加 RSS。gregorygundersen.com/blog/
Ning Ren retweeted

I just spent the last few days deep in the zone 🧠💻 updating the Decision Trees chapter of my FREE online e-book:
📘 Applied Machine Learning in Python 🐍✨
This chapter is now:
🌊 Flowing like a storybook
👐 Beginner-friendly - accessible!
📈📊 JAM-PACKED with visualizations & example code 🧪💡- actionable!
Whether you're just starting out or brushing up your skills, I hope it helps you crush it in #MachineLearning & #DataScience 🚀🤖📚
🆓 Read it online, download and use it! No paywalls, no ads — just pure ML goodness 💥geostatsguy.github.io/Machin… ∀!
#Python #AI #Coding #TechForAll


