
Biochemist, genome scientist, teacher at Penn State Univ. Genomic approaches to understand regulation of gene expression. Enjoy guitar and hiking.
- Tweets79
- Following86
- Followers401
- Likes410
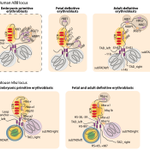






ALT Differential expression of globin genes by changes in interactions with the LCR. In these conceptual illustrations, interaction with a transcriptionally active zone [i.e., a hub, factory, or biomolecular condensate (yellow-orange ovals)] anchored on the LCR leads to the expression of a globin gene. Shifts in the genes interacting with the LCR active zone in erythroid cells at progressive stages of development result in differential expression. Areas with brown circles indicate repression. The different interactions are shown as occurring within the subTAD containing the LCR and globin genes. Similar shifts in patterns of interaction of genes with the LCR are indicated for both the (a) HBB and (b) Hba gene clusters. No information is currently available on LCR–gene interactions for the HBB locus in embryonic primitive erythroblasts, indicated by the dashed outline around the illustration. Abbreviations: HS, hypersensitive site; LCR, locus control region; TAD, topologically assoc. domain

ALT Enrichment of heritability in 587 traits from the UK Biobank GWAS in our collection of cCREs in human blood cells. Variants associated with blood cell traits were highly and significantly enriched in these cCREs, but not variants associated with other traits.

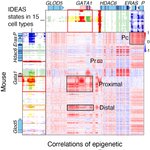
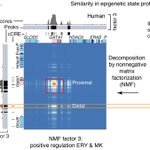
ALT (A) Map of sequences that align (black diagonal lines) between human and mouse in this locus, along with locations of binding by the transcription factor GATA1, the coactivator EP300, candidate cis-regulatory elements (cCREs), and gene locations. As indicated in the motivating example in the first tweet, the distal regulatory region for the mouse Gata1 gene does not align with human. (B) NMF factor 3 brings out the distal and proximal regulatory regions for GATA1 genes, along with addition potential regulatory elements. Factor 3 is extracted as a quantitative signal on which peaks can be called (shown along the axes).





ALT Effects of sheared chromatin length on ChIP-seq quality and sensitivity