

Weather + Climate | Look Up 🚀 | Florida State PhD + Michigan Go Blue! | Cat 6 🐈 | SI @weathertrader | Maps at @ForecastEagle + https://xitter.cf/t.co/RZoMToAx1q
Atlanta, GA
Joined September 2008
- Tweets30.9K
- Following5.9K
- Followers154K
- Likes74.3K


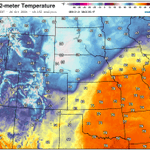


How will you adapt to the extra 1°C in global temperature compared to the last 50-years?
Global temperature today averaged 15.5°C and highest on record, and 1.08°C above the median for the past 50-years.
Yes, the planet is getting colder but that's because Northern Hemisphere winter is coming soon, and even with an El Niño raging in the tropical Pacific, the preponderance of land including North America and Eurasia --> ability of snow-cover + radiational cooling and a frozen Arctic to discharge heat into space.
However, the January 2027 winter globally averaged temperature will be considerably above normal and Canada + Arctic will be the warmest relative to the past 50-years.

You can view the global temperature "climate pulse" updated daily at Celsius Earth.
celsius.earth/pulse 📈

Arctic Polar Vortex could break down as the 10 hPa wind at 60°N may reverse to easterly into early November.
The AIFS Ensemble shows 6% chance (3 members out of 50) while full physics EPS at 18/50 = 36%
Weather + GIS:
Polar Vortex Earth --> polarvortex.earth/


Ryan Maue retweeted

Hurricane Patricia Reanalysis — Was the Historic Peak Even Stronger?
This continues the Category 5 series (Eastern Pacific in this case) with a very thorough analysis of all available data to determine the best single intensity estimate.
Official NHC (TCR) — 23 October 2015
Winds: 185 kt (215 mph)
Pressure: 872 mb
Location: Eastern Pacific (southwest of Manzanillo, Mexico)
WxProbe Reanalysis:
MSW: 190 kt
MSLP: 872 mb
Reconnaissance
Patricia’s absolute peak intensity occurred during an 11-hour reconnaissance gap. During that interval, the satellite presentation (ADT CI) continued to improve through 1200Z. Here’s the pertinent data:
0446Z AF303: 894 mb raw (center sonde 25 kt → adjusted to 891 mb), max flight-level wind of 179 kt at 4 n mi.
0646Z AF303: 885 mb raw (center sonde treated as 57 kt in TCR → adjusted 879 mb), max flight-level wind of 192 kt at 3 n mi (including 1-second spike of 201 kt). Real-time SFMR of 182 kt; post-processed SFMR peaks to 187 kt (Henning et al. 2016; Klotz reanalysis). RMW contracted to 3 n mi.
The aircraft departed while the storm was still deepening. These are the respective observations when recon next sampled the core:
1733Z NOAA3: max flight-level wind was still 192 kt at 8 n mi (VDM; secondary summaries list 191 kt), operational SFMR 166 kt revised to 180 kt after HRD brightness-temperature reprocessing, pressure already higher (VDM at 883 mb with 45 kt → adjusted to 878 mb). Early ERC signatures present.
2044Z: 910 mb with 68 kt → adjusted to 903 mb; flight-level wind of 160 kt. Rapid filling well underway.
The observed rates while aircraft were present taking into consideration the estimated lowest pressure of 872 mb at 1200Z:
* 0446Z–0646Z (2 h): pressure −6 mb/hr, flight-level wind +6.5 kt/hr, RMW 4 to 3 n mi.
* 1200Z–1733Z (5.55 h): pressure +1.1 mb/hr (872 → 878 mb).
* 1733Z–2044Z (3.2 h): 8 mb/hr filling rate once ERC matured.
Pressure
Adjusted pressure at the 192 kt pass was 879 mb. The satellite organization continued to improve until 1200Z. A moderated continuation of the pre-gap −6 mb/hr rate (1.3 mb/hr, which is 22% of the observed rate) across the 5.2 hour gap produces 872 mb at 1200Z. This connects directly to the next observation: 872 mb → 878 mb at 1733Z = +1.1 mb/hr, matching the precisely calculated slow initial filling rate. Anything deeper than 872 mb is possible, but not assured.
Structure
As shown above, the RMW contracted to an astoundingly small 3 n mi at the 192 kt maximum (pinhole). In addition,
mean of the nonzero R34 was compact at 110 n mi, with hurricane-force winds only to 15–16 n mi from the center.
Single wall at peak. No size veto required.
Reduction Factor
A radius of maximum wind of ≤ 5 n mi and pressure below 900 mb support the 0.95 bin (Powell et al. 2009; Patricia SFMR-to-flight-level ratios of 0.95). Patricia’s values were obviously well-below those thresholds.
Flight-level interpolation (single undersample step):
Pre-gap rate was +6.5 kt/hr. A continuation of *only* +1.2 kt/hr (18% of the observed rate) for 5.2 hours = +6 kt. This translates as
192 kt → 198 kt at 1200Z.
Return leg: 198 kt → 192 kt at 1733Z = −1.1 k/hr, consistent with the +1.1 mb/h slow filling while the flight-level wind remained at 192 kt.
These equate to 198 kt × 0.95 = 188 kt → 190 kt, constrained by the measured SFMR values already in the 180–187 kt range. The undersample step is counted once via the interpolation, and 198 kt is the conservative end of that single step. I’ll add that the 192 kt /187 kt pair (ratio of 0.97) and other observed SFMR-to-flight-level ratios near 0.94–0.95 indicate that a higher combination — 202 kt flight-level with a 0.96 factor — would yield 195 kt. This remains a possible high-end, but is not assured. Without direct sampling in the peak window, it isn’t an advisable choice under the methodology, which caps the factor at 0.95 and publishes the conservative single-step result.
Pressure Check
KCZ on 872 mb and the compact R34 is consistent with the upper end of the observed range.
Final Estimate:
MSW: 190 kt (220 mph)
MSLP: 872 mb
RMW: 3 n mi
Time: 1200 UTC 23 October 2015
That is a 5 kt revision of the official wind, while pressure remains unchanged. This further solidifies Patricia’s place as containing the most extreme intensity ever reliably measured in a tropical cyclone, worldwide.
Framework Notes
The flight-level-to-surface factor is selected by the radius of the sampled wind maximum, with pressure and outer size able to veto that first guess. In the most compact cores (RMW ≤ 5 n mi and pressure under 900 mb), the factor can reach 0.95. This ceiling is supported by Powell et al. (2009) and by the Patricia 2015 observations themselves (Rogers et al. 2017; Henning et al. 2016; NHC TCR), where SFMR-to-flight-level ratios reached 0.95. The operational mean remains at 0.90 (Franklin et al. 2003). A small RMW does not justify the highest factors if the mean of the nonzero R34 quadrants is on the order of 140 n mi, or an outer eyewall is active. An undersample of peak intensity is counted once only. Knaff–Zehr–Courtney (KZC) is used as a consistency check. The hour is assigned to the locked apex pair.
Sources: NHC TCR (Kimberlain et al. 2016); Henning et al. (2016) AMS preprint; Rogers et al. (2017) BAMS; HRD SFMR reprocessing (Klotz); vortex data messages 0446Z, 0646Z, 1733Z, 2033Z.


11 Years Ago: Revisiting Hurricane Patricia’s Historic Peak
Yesterday morning marked 11 years since Hurricane Patricia reached its historic peak — the most extreme intensity ever reliably measured in a tropical cyclone, worldwide.
Consequently, I have prioritized a very thorough reanalysis of all available data to determine the best single intensity estimate, consistent with the ongoing Category 5 series. The post will examine the observed rates, structural details, and what likely occurred during the reconnaissance gap when #Patricia reached its apex.
I hope to have the reanalysis completed and released later this evening.


