





Sharad Thaper retweeted
Structuring your subscription offer the right way has a dramatic impact on how many first-time buyers opt in.
To go from the average 20% to 35%+ take rate, optimize your product page as follows:
1. Default to subscriptions (don’t leave it to chance and have users actively opt into it)
2. Front-load the incentive (strong offer for the first order)
3. Show flexibility and remove risk from subscribing (show ability to skip, pause, cancel and any money back guarantee)
4. Improve choice architecture (multiple subscription options that anchor on the middle option)
5. Make value obvious (not just price)
6. Match customer behavior (match cadence to how customers actually use the product)

💯

Reasons why:
Some of the brands can eat an unholy high cac - which you likely cannot
There's a huge disconnect between the content people think consumers want to watch and what they actually want to watch
Paid is behind organic anyway
I think copying big brands has been one of the worst things to happen to creative strategy
Since not looking at brands our ad results have never been better
Structuring your subscription offer the right way has a dramatic impact on how many first-time buyers opt in.
To go from the average 20% to 35%+ take rate, optimize your product page as follows:
1. Default to subscriptions (don’t leave it to chance and have users actively opt into it)
2. Front-load the incentive (strong offer for the first order)
3. Show flexibility and remove risk from subscribing (show ability to skip, pause, cancel and any money back guarantee)
4. Improve choice architecture (multiple subscription options that anchor on the middle option)
5. Make value obvious (not just price)
6. Match customer behavior (match cadence to how customers actually use the product)
Sharad Thaper retweeted
My best ads are the ones with the lowest frequency in the ad account and a ton of ad spend.
Makes sense since this is a great indicator of an ad that is converting cold traffic very well.

Sharad Thaper retweeted
A solid mini-VSL ad.
1. Strong unique mechanism tied to Native American rituals and backed by science
2. Opening could be a little stronger by promising a bigger payoff, but the ad works and has been scaling
3. Doesn't introduce the product until after 2 min in
Sharad Thaper retweeted
Great article. A few related thoughts:
1. A higher AOV isn't always the best idea. As your AOV increases, the audience pool that is likely to buy at that given moment shrinks. Sometimes it's easier to scale at a lower AOV.
2. Many times, more ad impressions are needed to convert that smaller audience at the higher price point, leading to higher frequencies and higher CACs (which is also being driven by the higher CPMr). However, a higher CAC isn't always a bad thing (see point 3 below)...
3. Not only do CRO and media buying need to be tied together, but retention and LTV modeling also need to be a part of the same conversation.
It's easy to declare a “winner” based on CAC/ROAS/conversion rate, but that can be misleading if you’re not looking at the downstream effects of the ads, landing pages, and offers.
Sometimes, a landing page variant with a higher CAC can lead to a better 3-month/6-month LTV.

A brand told me they improved their offer structure, increased their first order AOV, shortened their payback period, sounds like a winner right?
CAC went up with the higher offer, obvious right?
CPMr started climbing, ok if payback was better right?
But reach started to drop.
Then their funnel started to dry up.
New customer volume started to shrink.
YoY growth was a distance memory.
Read the full article to find out why →
Sharad Thaper retweeted
Posted a 4+ hour long video on building advertorials with AI on YT.
Link in bio.
A solid mini-VSL ad.
1. Strong unique mechanism tied to Native American rituals and backed by science
2. Opening could be a little stronger by promising a bigger payoff, but the ad works and has been scaling
3. Doesn't introduce the product until after 2 min in
Great article. A few related thoughts:
1. A higher AOV isn't always the best idea. As your AOV increases, the audience pool that is likely to buy at that given moment shrinks. Sometimes it's easier to scale at a lower AOV.
2. Many times, more ad impressions are needed to convert that smaller audience at the higher price point, leading to higher frequencies and higher CACs (which is also being driven by the higher CPMr). However, a higher CAC isn't always a bad thing (see point 3 below)...
3. Not only do CRO and media buying need to be tied together, but retention and LTV modeling also need to be a part of the same conversation.
It's easy to declare a “winner” based on CAC/ROAS/conversion rate, but that can be misleading if you’re not looking at the downstream effects of the ads, landing pages, and offers.
Sometimes, a landing page variant with a higher CAC can lead to a better 3-month/6-month LTV.
A brand told me they improved their offer structure, increased their first order AOV, shortened their payback period, sounds like a winner right?
CAC went up with the higher offer, obvious right?
CPMr started climbing, ok if payback was better right?
But reach started to drop.
Then their funnel started to dry up.
New customer volume started to shrink.
YoY growth was a distance memory.
Read the full article to find out why →

Stop looking at ad spend and ROAS in isolation.
It's so important to look at the future value created by your current ad spend.
This means looking at the LTV created by your current ad spend 3 months, 6 months, and 12 months into the future.
Here's how:
1. Start with Attributed Spend
This is what your platform thinks drove conversions ($4.1K here, trending down slightly).
As a marketer, this is your baseline, and it tells you where credit is being assigned, not necessarily where value is created.
2. Immediate ROAS
At 1.3x and slightly declining, this tells you that campaigns are still profitable/break even, but momentum is softening
How to use it:
Great for tactical decisions (budget shifts, creative tests)
Don’t overreact to small dips (this metric is volatile)
Pair with customer mix: fewer new customers = future risk
3. New vs Repeat Customers
If the volume of repeat customers is rising but the number of new customers is falling, scale new customer acquisition. Immediate ROAS may look fine while future growth quietly declines due to the lack of new customers being acquired.
4. Incremental Value
Understand how your campaigns are far more valuable than immediate ROAS suggests.
How to use it:
- Justify higher CAC on channels driving long-term value
- Identify campaigns that look “meh” short-term but win long-term
- Shift budget toward incrementality, not just platform attribution
The playbook from this view:
- Don’t optimize purely on immediate ROAS
- Protect and scale campaigns with strong incremental lift
- Fix new customer acquisition before it impacts future revenue
- Use attributed spend as a guide, not a source of truth

Most brands simply don't send enough emails.
This is true in nearly all cases.
However, there is one exception.
Sending more emails works to a point.
Then at a certain threshold, sending more emails to more segments has diminishing returns as your costs increase.
Here’s how to figure out if you’re sending enough emails:
1. Create a segment of a random sample of your list
2. Divide the segment in half
3. Increase the sending volume of campaigns for one half of the segment while keeping the sending volume the same for the other half
4. Continue this holdout test for the next 30 to 60 days
If more revenue is generated from the half with the increased sending volume, in most cases, it indicates that you’re not sending enough emails.
Otherwise, it will demonstrate that increasing the number of emails will not mean more profit.
Shockingly, AI still isn’t great at writing DR copy unless you know what to look for and know how to guide it in the right direction.
Principles >>>>

I really used to think that DR was gonna get totally commoditized by AI because the access to that information was becoming incredibly easy.
but with these new done for you AI marketing tools like Higgsfield marketing studio, I think we'll just see more AI marketing slop. Stuff that looks cool but doesn't convert bc it neglects DR principles and fundamentals.
which is fkn fantastic news for me and anyone that's actually skilled in DR.
Sharad Thaper retweeted
Have seen landing page tests where a variant with worse CAC actually led to better LTV over time.
Easy to declare a “winner” based on CAC/ROAS/conversion rate, but that can be misleading if you’re not looking downstream.


Have seen landing page tests where a variant with worse CAC actually led to better LTV over time.
Easy to declare a “winner” based on CAC/ROAS/conversion rate, but that can be misleading if you’re not looking downstream.
Sharad Thaper retweeted
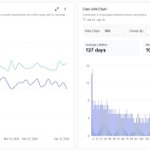
When we're analyzing subscription churn, we rely on a comprehensive framework to understand why customers are leaving and where the opportunities are to improve retention:
1. Overall churn trends
We start by looking at total churn and blended churn rate over time. This helps us quickly spot volatility, seasonality, or recent changes that may have impacted retention. A flat average can hide a lot of swings underneath—so trend lines matter.
2. Cohort-based churn
Next, we analyze churn by original order date and relative lifecycle milestones (Day 30, Day 60, etc.).
This is where patterns emerge:
Are customers dropping off early? → onboarding or expectation mismatch
Are they churning later? → product fatigue or pricing sensitivity
3. Product-level churn
Not all products behave the same. Breaking churn down by SKU often reveals:
Hero products with strong retention
Underperforming products dragging overall churn up
This is usually where the fastest wins come from (bundling, swaps, or repositioning offers).
4. Churn rate over time by product
We layer in time to see if specific products are trending worse (or better).
This helps isolate:
Inventory or fulfillment issues
Changes in customer experience
External factors (seasonality, promotions, etc.)
5. Subscription lifetime distribution
Looking at average + median lifetime and the distribution curve gives us a reality check:
Are we relying on a small group of long-term subscribers?
Is there a sharp drop-off early in the lifecycle?
This informs LTV assumptions and how aggressive we can be with acquisition.
6. Cancellation reasons (what's the reasoning behind their decision?)
The qualitative data provides the story behind the raw data and allows us to improve customer service while optimizing the email and SMS flow messaging and timing.
How we turn this into action:
Once we identify the patterns, we map them to specific interventions:
Early churn → onboarding flows, education, trial optimization
Mid-cycle churn → replenishment timing, reminders, incentives
Product-specific churn → swaps, bundles, or reformulation
Late churn → loyalty, subscriptions perks, or pricing strategies