

Agentic Analytics powered by Semantic Layer.
Joined October 2018
- Tweets1.3K
- Following587
- Followers2.2K
- Likes875


Fast aggregate queries aren't just about making tables smaller. Cube Store uses sorted indexes, partition pruning, and local worker copies. In a TPC-H-derived study, every reported median and p90 stayed below one second.
cube.dev/blog/cube-store-per…

An AI agent shouldn't have to rebuild your metric definitions before it can build a dashboard. Snowflake CoCo can use Cube via MCP or CLI to query governed Snowflake Semantic Views and save the result as a shareable dashboard. cube.dev/blog/cube-snowflake…

Data questions in a spreadsheet usually wait on someone to write the query. Analytics Chat in Cube for Sheets and Excel builds it from your data model, writes results to the sheet, and can add related reports, filter, and save explorations.
Full demo: youtube.com/watch?v=TR3iN9Nt…
Cube now supports Apache Ossie import and export for semantic models. Export a Cube YAML model or view, or import an Ossie model as Cube YAML via the CLI or Platform API: cube.dev/changelog/2026-10-1…

ALT Cube and Apache Ossie integration
Do these two measures move together? Cube scatter charts plot one against the other, size points by a third measure, color by a dimension, and add small multiples or a trend line when one view isn't enough.
Full demo: youtube.com/watch?v=s4zR9YeT…
A dashboard that needs scrolling usually covers more than one topic. Tabs containers in Cube split it up: add charts, stacks, or grids to each tab, keep shared controls above the tabs, or scope a control to a single tab.
Full demo: youtube.com/watch?v=X3k8wDYy…
Feedback on a chart is most useful next to the chart. Comments in Cube go on a whole dashboard or a single chart: mention teammates, track replies in your inbox, and resolve threads without losing the history.
Full demo: youtube.com/watch?v=ESVG7uGP…
ClickHouse makes aggregate queries fast. Agreeing on what the numbers mean is harder. Here an agent builds dashboards on one Cube semantic model, a chart is revised in chat, and Claude and ChatGPT answer from the same governed definitions.
Full demo: youtube.com/watch?v=o56Lz_J1…
An empty bucket is still a result. Cube's bins and value groups now show each bin's distribution and row count as you build, start range modes from the column's min and max, keep empty bins in the output, and filter by bucket label.
Full demo: youtube.com/watch?v=3hg9GZkS…
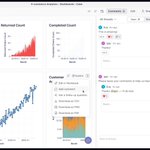
Cube now supports comments on Dashboards and individual charts. Reply in threads, mention teammates, react, and resolve discussions when they’re done. Keep questions alongside the data that prompted them: cube.dev/changelog/2026-10-0…

ALT Comments
Cube’s preview integration publishes Cube Views to Databricks Unity Catalog as native metric views. Preview generated YAML, test access with a temporary view, and publish each view independently.
Full demo: youtube.com/watch?v=LTIQHZ9N…

Line and area charts in Cube make time-series changes easier to read. Compare multiple series, switch to dashed or stepped lines, fit trend lines per series, and clean up crowded axes.
Full demo: youtube.com/watch?v=Qzk-aSfM…

Composite charts in Cube put several measures in one view. Mix bars and lines, give differently scaled metrics a second axis, or keep a shared scale for direct comparison.
Full demo: youtube.com/watch?v=L3HClgUs…

Bar charts in Cube make dimensional comparisons flexible. Break down a measure, switch between grouped, stacked, and horizontal layouts, then refine the story with labels, colors, and tooltips.
Full demo: youtube.com/watch?v=-sm-GhWx…

Grid containers in Cube Dashboards give charts and controls a precise layout. Set fixed rows and columns, place and resize widgets, and keep movement constrained to open cells. How would you use grids in your next dashboard?
Cube dashboard builder now has spacers, dividers, grids, drag-to-add, and multi-select move, making larger dashboard layouts faster to structure and reorganize.
Full demo: youtube.com/watch?v=1hgloRNL…

Cube period comparison now covers reports with only a date filter and measures compared across multiple dates side by side, with presets following the dashboard window.
Full demo: youtube.com/watch?v=9GlOez6P…

Agentic analytics needs tests, not vibes. Cube Evals lets teams version benchmark questions, run them against an agent, and catch semantic model regressions before users see wrong answers. cube.dev/blog/introducing-cu…

Cube dashboard parent controls save filter + time-granularity combinations as reusable views, then expose them on a published dashboard so viewers can switch context fast.
Full demo: youtube.com/watch?v=ygYTB8r7…
