Gold attempted recovery but failed near $4,150 against the US Dollar. The price trimmed most gains and traded below the $4,020 support.
The 4-hour chart of XAU/USD indicates that the price settled well below $4,000, 100 Simple Moving Average (red, 4 hours), and the 200 Simple Moving Average (green, 4 hours). It traded as low as $3,832 and is currently consolidating losses.
On the upside, the bears might remain active near $3,900 or the 23.6% Fib retracement level of the downward move from the $4,148 swing high to the $3,832 low.
The first major resistance could be $3,950 or the 50% Fib retracement level at $3,990 since it is close to the 100 Simple Moving Average (red, 4 hours) at $4,070. The main resistance might be $4,075 and the 200 Simple Moving Average (green, 4 hours).
A clear move above $4,075 could open the door for more upside. In the stated case, the bulls could aim for a move toward $4,150. If there is a fresh decline, the price could test $3,820. The first major support sits at $3,765. The next support could be $3,720, below which the price might slide to $3,500. Any more losses could clear the path for a test of $3,350.
• US Import Price Index for Oct 2026 (MoM) – Forecast +0.7%, versus +1.1% previous.
• US Export Price Index for Oct 2026 (MoM) – Forecast +0.3%, versus +2.2% previous.
• US Retail Sales for Oct (MoM) – Forecast +0.2%, versus +0.8% previous.
• US Industrial Production for Oct (MoM) – Forecast +0.1%, versus +0.7% previous.
– The Daily by @AayushJs
1
48
🏦 Why do Federal Reserve governors’ speeches matter to traders?
🇺🇸 Fed Governor Christopher Waller's recent comments on a possible 0.50% interest rate hike showed how quickly market expectations can change.
📈 Discover why traders should follow more than just the Fed chairman, and how speeches can create trading opportunities in USD/JPY, gold, stock indices and oil.
Read more 🔽
ow.ly/uBKi5107b1f
41
XTIUSD drops 4.37% to $85.20 as signs of ample physical oil supply outweigh Middle East export risks. RSI trends lower at 35.29, leaving room before hitting oversold territory. Key technical levels to watch: immediate support sits at $85.00, while major resistance holds at $94.50.
Black Friday is back! 🔥
Black Friday 2026 pre-registration is now open!
💰 USD 5 cashback for every USD 100,000 in trading volume!
🎉 100 lucky winners will receive 5,000 Titan Points each!
📅 8 days only, starting November 23!
Pre-register now 👇
titanfx.com/black-friday-202…
51
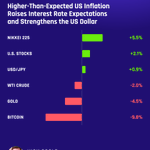
💵 USDJPY approached 160 after higher U.S. inflation, raising intervention concerns.
📈 The Dow and Nikkei recovered some recent losses.
🥇 Gold fell as expectations of a December Fed rate hike increased.
🛢️ WTI rebounded late in the week as U.S.-Iran tensions continued.
₿ Bitcoin dropped below $70,000 amid heavy selling.
📅 This week: U.S. Retail Sales, Consumer Sentiment and Japan CPI.
ow.ly/yn2e5106NKK
75
The Euro failed to remain stable above 1.1110 against the US Dollar. EUR/USD extended losses after it settled below 1.1080.
Looking at the 4-hour chart, the pair gained bearish momentum and even tested the 1.1015 level. It traded as low as 1.1016 and is currently well below the 100 simple moving average (red, 4-hour) and the 200 simple moving average (green, 4-hour).
If there is a recovery wave, the pair could face resistance near the 23.6% Fib retracement level of the downward move from the 1.1251 swing high to the 1.1016 low at 1.1070.
The first major resistance might be 1.1115 or the 50% Fib retracement level at 1.1133. The main resistance could be near the 100 simple moving average (red, 4-hour) at 1.1160. A close above 1.1160 could push the pair further higher.
In the stated case, the pair might revisit the 200 simple moving average (green, 4-hour). Any more gains could open the door for a move to 1.1250.
If there is a fresh decline, the pair might find support near 1.1015. The first major support might be 1.1000. A close below 1.1000 might put some pressure on the bulls. In the stated case, the pair might drop to 1.0945
Upcoming Key Economic Events:
• ECB's Vujčić speech.
• Eurozone Industrial Production for Sep 2026 (MoM) - Forecast +0.6%, versus -0.5% previous.
– The Daily by @AayushJs
2
81
Lionsgate is a major independent studio that produces and distributes movies and TV. It was founded in 1997 in Vancouver by Canadian financier Frank Giustra, who named it after the Lions Gate bridge. The company later set up its main operations in Santa Monica. It grew by buying other independent studios and taking risks on bold projects.
Today it has a catalog of more than 20,000 titles and owns big franchises like The Hunger Games, John Wick, Twilight, and Saw. It also produces more than a hundred series and shows for networks and streaming platforms.
In May 2025, the company completed a full split between its studio business and the Starz pay network. Now it’s focused only on making and distributing content. Growth comes from the catalog and new releases.
$LION started 2026 at $9 and hit a record high on June 26 with an intraday peak of $16.70 and a closing high of $16.40.
Here are five reasons investors are watching it for 2027:
· Pure-play status. Since the official split from Starz, the company operates as a standalone studio focused only on content. That removes the discount tied to declining cable TV and makes the business easier for investors to understand.
· Takeover potential. As one of the last big independent studios still publicly traded, with a catalog of more than 20,000 titles, Lionsgate is a natural target. Buyout talks were restarted in fall 2026, and the rumors are still going around.
· A 2027 release slate built on known brands. Management is leaning on established franchises to lower commercial risk. Ten of the next 15 theatrical releases are based on existing properties. The 2027 calendar includes The Resurrection of the Christ: Part One (May 2027), the John Rambo prequel (June 2027), a new Blair Witch movie (September 2027), and The Housemaid’s Secret (December 2027), plus the big residual impact from The Hunger Games: Sunrise on the Reaping, which came out in late November 2026.
· Catalog monetization and cash flow. Revenue from the film and TV library has topped $1.04 billion over the past 12 months, with cash margins around 60%. That recurring base is helping the company pay down debt.
· Technical setup. The most watched signal is the Golden Cross (when the 50-day moving average crosses above the 200-day). The December 2025 Golden Cross worked well.
174
XAUUSD faces selling pressure at $3880.12 as energy-driven inflation fuels Fed tightening fears. Bearish momentum holds as price hugs the lower Bollinger Band with RSI at 37.25 still not yet in oversold territory, awaiting consolidation. Key support sits at 3860 and resistance at 4150.
The US Dollar remained supported above 157.50 against the Japanese Yen. USD/JPY formed a base and started a fresh increase above 158.00.
Looking at the 4-hour chart, the pair cleared many hurdles, including a contracting triangle with resistance at 158.50. More importantly, there was a close above 159.00, the 100 simple moving average (red, 4-hour), and the 200 simple moving average (green, 4-hour).
The pair traded as high as 160.04 and is now consolidating gains. If there is another increase, the pair could face resistance near 160.20. The first major resistance might be 160.65.
The main resistance could be 161.25. A close above 161.25 could push the pair further higher. In the stated case, the pair might revisit the key hurdle at 162.00. If there is a downside correction, the pair might find support near the 159.50 level and the 23.6% Fib retracement level of the upward move from the 157.67 swing low to the 160.04 high.
The first major support might be 158.85. A close below 158.85 might put some pressure on the bulls. In the stated case, the pair might drop to the 100 simple moving average (red, 4-hour) at 158.20.
Upcoming Key Economic Events:
• US Producer Price Index for Oct 2026 (MoM) – Forecast +0.4%, versus +1.3% previous.
• US Producer Price Index for Oct 2026 (YoY) – Forecast +6.6%, versus +6.3% previous.
• Fed's Bowman speech.
• Fed's Daly speech.
– The Daily by @AayushJs
1
81
📊 Today’s USDJPY Market Outlook from Analyst Nick
🎯 Nick’s Focus: This week’s higher-than-expected U.S. CPI inflation data continues to support the dollar, as USD/JPY moves higher and tests whether Japanese authorities will intervene to support the yen.
The current uptrend remains strong, making buying on weakness the preferred strategy. Traders should avoid the temptation to sell in anticipation of potential Bank of Japan intervention.
The next key focus is tonight’s U.S. PPI inflation data.
📈 Stronger than expected → Bullish for USDJPY
📉 Weaker than expected → Bearish for USDJPY
Resistance: 160.00, 161.00, 162.00
Support: 158.00, 157.00, 156.00
1
365
📈 Are you taking profits too early?
Winning trades mean little if your losses are bigger than your profits.
🎯 Learn how to let your profits run, manage trailing stops, and avoid exiting too soon.
💡 Try our interactive lesson, watch real-time trade examples, and test your knowledge.
Learn more 👇
ow.ly/ky1s5105XJm
1
76
Nvidia’s founder is in the middle of two personal scandals at once. One involves an affair with a woman U.S. intelligence has linked to Chinese espionage. The other is a relationship with a direct subordinate. The board and the FBI are investigating, and the board is reportedly weighing whether to remove him. As a result, $NVDA has sold off hard.
Is this a buying opportunity, or is the key-man risk too high?
Huang was born in Taiwan in 1963 and spent part of his childhood in Thailand before moving to the U.S. at age nine. His early years in America were rough. He spent time at a strict boarding school in Kentucky where he was bullied and cleaned toilets every day. Once he rejoined his parents in Oregon, he worked as a dishwasher and waiter at Denny’s while doing well in school. He earned a bachelor’s in electrical engineering at Oregon State, where he met his future wife Lori, then a master’s at Stanford.
After working at AMD and LSI Logic, he co-founded Nvidia in 1993 with Chris Malachowsky and Curtis Priem at a Denny’s in California. The early years were brutal and the company nearly went under more than once before it found its footing in video games. In 1999, Nvidia changed the industry with the GeForce 256, billed as the world’s first GPU. Huang ran the company with a direct, demanding style, managing dozens of executives with almost no middle layer.
The big bet came when he went all-in on AI years before most rivals. The combination of GPU computing power and the software ecosystem turned Nvidia into the default supplier for the biggest tech companies training AI models. That dominance pushed the market value past $5 trillion in October 2025. In the black leather jacket, Huang became a global tech star with a personal fortune above $150 billion.
Then the clean reputation cracked. The New York Times reported that Huang had an affair with Alice Huang, a senior executive at Singapore company Megaspeed. U.S. intelligence reportedly viewed her as a Beijing spy, raising fears that AI chips could be diverted to China. Huang publicly apologized to his family and employees.
Days later, the Times reported a second relationship with Kimberly Powell, vice president of healthcare and a direct subordinate. Former employees said the two were filmed acting affectionately at a hotel in San Jose. That put Huang in violation of the company’s own rules on hierarchical relationships.
The stock sold off as the stories piled up, wiping out hundreds of billions in market value in days and triggering shareholder lawsuits.
Nvidia had no obvious succession plan. Some analysts, including Dan Ives at Wedbush, have said the company could lose a large chunk of its value without Huang.
So, buy or not?
The no case is simple. Buying the dip is like catching a falling knife. It can pay off if the bounce comes, but it can cut you if the situation worsens. Huang is the company’s genius, the way Steve Jobs was at Apple. When Jobs left in 1985, Apple went into a long decline. Thinking about buying after a scandal is a bit like buying a flooded house. The land may be worth something long term, but you need to know the foundation is still solid.
The yes case is also simple. The company still controls an estimated 80% to 85% of the AI chip market. Net margins are above 63%. Analysts expect Nvidia to keep its lead for another three to five years, roughly through 2030–32, even if its share slowly shrinks.
– The Boss Move with @martinsth
1
2
259
AUDJPY rose 0.42%, supported by broad Yen weakness as hotter US inflation reinforced expectations of tighter Fed policy. However, softer Australian consumer confidence and business sentiment may limit further gains. The pair is testing resistance at 109.60, with a break potentially opening the way toward 109.818.
Start your trading journey with Dream Beyond Borders.
New customers only! Get up to USD 50 cashback. Offer ends on November 15!
Join with promo code 【FIRST50】👇
titanfx.com/promotions/cashb…
2
83
WTI Crude Oil prices failed to remain stable above $100.00 against the US Dollar. The price dipped below $92.00 to move into a short-term bearish zone.
Looking at the 4-hour chart of XTI/USD, the price settled below $90.00, the 100 simple moving average (red, 4-hour), and the 200 simple moving average (green, 4-hour). It traded as low as $84.11 and is currently attempting to recover.
On the upside, the price could face resistance at $87.50. There is also a bearish trend line forming with resistance at $87.50. The first major resistance could be near $92.00 and the 23.6% Fib retracement level of the downward move from the $105.60 swing high to the $84.11 low.
A close above $92.00 could send Oil prices toward $95.00. Any more gains could open the door for a move to $100.00. If there is another decline, the price might find bids near $85.00.
The next support sits at $82.50. The main support could be $80.00. A close below $80.00 could initiate a move to $76.50 in the coming days. Any more losses might send the price to $70.00.
– The Daily by @AayushJs
1
108
🧠 Analyst Nick’s Trading Psychology for Success
Act like the trader you want to become.
Before each trade, set your entry, stop, target, and lot size. Wait for your setup. Follow your plan.
Repeat these habits every day. Confidence grows when you can trust your own actions.
ow.ly/zWxE5105Frj
1
78
📊 Today’s USDJPY Market Outlook from Analyst Nick
🎯 Nick’s Focus: Higher-than-expected U.S. CPI inflation data strengthened the dollar. Markets now expect the Fed to raise interest rates by 0.25% at its next meeting, with a 10% chance of a larger 0.50% hike.
With the U.S. dollar remaining strong, buying on weakness still looks like the best strategy. However, traders should remain cautious of potential Bank of Japan intervention.
The next focus is Friday’s U.S. PPI data.
📈 Stronger than expected → Bullish for USDJPY
📉 Weaker than expected → Bearish for USDJPY
Resistance: 159.00, 160.00
Support: 157.00, 156.00, 155.00
1
90
Bitcoin price failed to remain above $80,000 against the US Dollar. BTC started a fresh decline and traded below the key support at $76,500.
Looking at the 4-hour chart, the price settled below $76,500, the 100 simple moving average (red, 4-hour), and the 200 simple moving average (green, 4-hour). The price traded as low as $73,598, and the price is now consolidating losses.
On the upside, the price is facing resistance near the 23.6% Fib retracement level of the downward move from the $81,113 swing high to the $73,598 low.
The first major resistance might be $76,500. The main hurdle now could be $78,800 or the 61.8% Fib retracement level. There is also a key bearish trend line formed with resistance at $78,800. A close above $78,800 could start another steady increase. In the stated case, the bulls could aim for a move to $82,000. Any further gain might call for a test of $83,500.
If there is a fresh decline, the pair might find bids near the $73,800 level. The first major support could be $72,000. A downside break and close below $72,000 could trigger a sharp decline. In the stated scenario, the price could test $70,000.
• US Consumer Price Index for Oct 2026 (MoM) – Forecast +0.3%, versus +0.6% previous.
• US Consumer Price Index for Oct 2026 (YoY) – Forecast +3.9%, versus +3.7% previous.
• US Consumer Price Index Ex Food & Energy for Oct 2026 (YoY) – Forecast +2.8%, versus +2.6% previous.
– The Daily by @AayushJs
1
80
📉 Could the AI bubble burst?
🇺🇸 US stocks fell sharply after the midterm elections as concerns grew over AI investment returns and tighter regulations.
🥇 Find out how falling AI stocks could affect gold, USD/JPY, the Nikkei 225 and other CFD markets, and why Anthropic's upcoming IPO could be a turning point.
Read more 🔽
ow.ly/TmL85105gUg
1
103