

Enhance your investments and trading strategy with our indicators. Optimize your Entry Points. Extend your Take Profits. Minimize your Stop Loss.
Wyoming, USA
Joined December 2020
- Tweets13.6K
- Following411
- Followers10.6K
- Likes3K




Pinned Tweet
Bitcoin
You may have heard us say that the crypto market "lacks liquidity." 80% of the time, the price is manipulated to liquidate positions. We explain why this happens, the battle between bots, and how this affects your trading.

Trading Different retweeted

📆 Semana movidita para los mercados.
El miércoles estaremos operando en vivo en el coworking de discord, son los escenarios que más nos gusta... bienvenida sea la volatilidad 🔥
Sumate al discord, link en la web de Trading Different.

Trading Different retweeted

Reservas bancarias en baja.
Esto drena liquidez de los mercados, se vienen correcciones en todo.

Trading Different retweeted

ethereum:native still looks like this too


I am still not looking for longs until this downside liquidity is swept.
Does that mean I get left behind? Potentially, but I can't long anything with that below ripple:native
Remember when bitcoin:native had that liquidity below us at $106,000? And I kept saying I was worried about it. Then October the 10th happened?
I'm not implying that happens again btw, I cannot predict the future, I'm just saying when we start to see a build up, I wait until it's cleared or use it as an area of interest to enter...


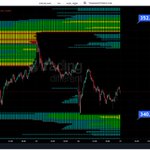
AAPL on 5 min chart 📊
Apple sits at $343.98 and is trying to stabilize after the pullback from the recent highs, with a bounce that is still not convincing. ⚖️📉
To the downside, liquidity stacks up at $340.40, a block that would come into focus if price loses the lows of the last few hours. 📉🧲
To the upside, a broad cluster waits at $352.90, a level that would come into play if buyers regain strength and push price higher. 🎯🚀
See the Liquidation Heatmap here:
👉 tradingdifferent.com/es/dash…
#AAPL #Apple #Stocks #WallStreet #LiquidationHeatmap #StockMarket #Trading #Nasdaq

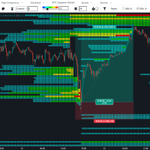
BTC on #Hyperliquid 15 min chart 📊
Bitcoin keeps consolidating and sits at $79,834, with bounces that fade ever faster and without enough strength to break the range ⚖️
With price still inside the range, $78,900 is the liquidity zone the market could go looking for if it loses the floor of the last few sessions. 📉🧲
On the bullish side, $81,000 is the level to win back for price to leave the recent pressure behind and look higher again. 🎯🚀
See the Liquidation Heatmap here:
👉 tradingdifferent.com/es/dash…
#BTC #Bitcoin #Crypto #LiquidationMap #LiquidityMap #BitcoinPrice #Trading

Visita nuestra web y conoce nuestras herramientas para traders de #Bitcoin y #altcoins y holders de #BTC youtube.com/watch?v=CBovD0RA…
Las ventajas que obtienen los operadores que comprenden la dinámica del mercado quedan en evidencia con la herramienta Liquidation Heatmap sumada a High Frecuency.
Identificar estas zonas de interés permite anticipar movimientos con mayor precisión y operar con una ventaja que la mayoría del mercado desconoce. #Bitcoin
tradingdifferent.com/es/dash…

Backtest #Bitcoin 12/03/24
Cuando una zona de liquidez importante ha sido barrida, al utilizar Liquidation Heatmap permite ubicar el stop loss en un área de menor exposición. Esto puede mejorar la relación riesgo/beneficio y reducir la probabilidad de ser expulsado de manera prematura del mercado. Un backtest riguroso sobre datos históricos es clave para validar esta operativa.
tradingdifferent.com/es/dash…

⚠️ $SPY | Scalping liquidation map
Price: 765.9
🔺 Shorts at risk above:
• 767.7–779: pockets of high/max leverage close to price
• 781–790: the biggest spike on the map, peaking near 782.5
• 793–805: another steady block further up
🔻 Longs at risk below:
• 752–760: a high/max pocket
• 734.7–750: a dense cluster, peaking near 741
• 705–730: a broad base
📊 Cumulative long liquidations below are about 1.5× the shorts above. The nearest heavy liquidity, though, sits above: the biggest spike on the map is just ~2% away.
The map doesn't predict direction. It shows where leveraged positions would be liquidated if price reaches those levels.
Do your own monetary analysis with Trading Different.
👉 tradingdifferent.com/es/dash…
#SPY #SP500 #ETF #Trading #Liquidations

📊 #BTC | Aggregated data in 1h
BTC trades at $80,334, still ranging just above the $79,178 low from Oct 24. The range high is $84,875.
🔹 Coinbase spot: a spike near 120M today, the biggest of the whole period, beating even the Oct 20–21 breakout. Heavy spot buying showed up near the lows.
🔹 Open Interest: $38.61B. It ticked up toward $39B with the move and gave it back right away. Leverage isn't following.
🔹 Liquidations: small, $79K in longs and $466K in shorts on the current candle.
🔹 Hyperliquid: 149M, moderate.
Strong spot demand is defending the range lows, while derivatives stay cautious.
Do your own monetary analysis with Trading Different.
👉 tradingdifferent.com/es/dash…
#Bitcoin #BTC #Crypto #Liquidations #OpenInterest

Trading Different retweeted
El Tesoro de Estados Unidos 🇺🇸 gasta más de lo que recauda, así que varias veces por semana pide dinero prestado vendiendo títulos de deuda en subastas públicas.
Este gráfico mide cuánto dinero le quita al sistema bancario ese préstamo, día a día.
El dinero sale de las cuentas de quienes compran la deuda y entra en la cuenta que el Tesoro tiene en la Reserva Federal, donde deja de circular hasta que el Gobierno lo gasta.
Lo pueden comparar en todo el histórico, contra Bitcoin, S&p500, Nasdaq, Oro y Oil.

Arranca una semana cargada para el mercado 🇺🇸
El plato fuerte llega el miércoles: la Fed anuncia su decisión de tasas. Es el evento que más volatilidad podría traer. ⚡
El jueves sigue la acción con el PCE subyacente y el PIB, dos datos clave para medir la inflación y el ritmo de la economía. 📊
Y durante toda la semana siguen los resultados de empresas, que pueden mover al mercado día a día.
Semana para ir con calma y atentos a la liquidez 👀
#Fed #FOMC #PCE #PIB #Bitcoin #Crypto #Trading #Mercados

BTC on #Hyperliquid 15 min chart 📊
Bitcoin sits at $80,299 after another failed attempt to extend the rebound, and it is feeling selling pressure again. 📉
On the upside, $81,400 is the immediate target if buyers manage to pull price out of this weakness. 🎯
On the downside, $78,900 holds a dense block of liquidity that would be exposed if the drop gains traction. 🧲
See the Liquidation Heatmap here:
👉 tradingdifferent.com/es/dash…
#BTC #Bitcoin #Crypto #LiquidationHeatmap #CryptoMarket #MarketUpdate

El backtesting es fundamental en el desarrollo de una estrategia de trading sólida.
La herramienta #Backtest te permite elegir días específicos para estudiar el comportamiento del precio, identificar patrones recurrentes y evaluar el rendimiento de tus estrategias antes de aplicarlas en tiempo real. #Bitcoin
tradingdifferent.com/es/dash…

Con la herramienta High Frequency, selecciona los pares de activos que dominas y opera con mayor precisión. #Bitcoin
tradingdifferent.com/es/dash…

⚠️ $BTC | Swing liquidation map (3x, 5x, 10x, 25x)
Price: $80,723
🔺 Shorts at risk above:
• An almost empty gap up to ~$87,200
• $87,200–$92,500: the main block, peaking near $91,700 with heavy 10x and 25x
🔻 Longs at risk below:
• $69,000–$80,000: steady but moderate pockets of 10x and 25x
• $53,400–$57,600: the biggest block below, peaking near $57,400
• $44,400–$48,000: a broad base of 3x and 5x
📊 Cumulative long liquidations below are roughly 4× the shorts above. On the swing map the nearest heavy liquidity is the short block, ~8% above, while the big long block is ~30% below.
The map doesn't predict direction. It shows where leveraged positions would be liquidated if price reaches those levels.
Do your own monetary analysis with Trading Different.
👉 tradingdifferent.com/es/dash…
#Bitcoin #BTC #Crypto #Liquidations

📊 #BTC | Aggregated data in 1h
It's a quiet Sunday. BTC moves sideways at $80,717, consolidating after Oct 24's flush to $79,178. The range high is $84,875.
🔹 Open Interest: $38.66B. It slipped on the drop and has been drifting lower since. Leverage isn't coming back yet.
🔹 Volume: $428M in the current hour, below its average ($631M).
🔹 Coinbase spot: 4.7M, very low.
🔹 Hyperliquid: 36M, quiet.
🔹 Liquidations: practically zero, $0 in longs and $120 in shorts.
The market is digesting the flush with low volume and OI on hold.
Do your own monetary analysis with Trading Different.
👉 tradingdifferent.com/es/dash…
#Bitcoin #BTC #Crypto #Liquidations #OpenInterest

Trading Different retweeted

📍 bitcoin:native | El bloque de longs se intensificó debajo del mínimo
Bitcoin cotiza en 80.785 después del barrido del día 24, que tocó un mínimo de 79.178.
🔻 Abajo:
• 77.600–79.150: el bloque de longs se armó justo debajo del mínimo de ayer y ahora es el más intenso del mapa. El núcleo, en rojo, está en 79.148, a un ~2% del precio.
• 76.000–76.900: otra franja cargada más abajo.
⚡ Las franjas de 79.600–80.500 ya las consumió la caída del 24.
🔺 Arriba: en la parte visible del mapa casi no quedan franjas activas de shorts cerca del precio.
Ayer el precio frenó apenas encima de esta zona, y desde entonces debajo se siguió acumulando apalancamiento long.
El mapa no indica la dirección del precio. Muestra dónde están las posiciones apalancadas que serían liquidadas si el precio llega a esos niveles.
#BTC
🔗 tradingdifferent.com/code/rT…

Trading Different retweeted
📍 ethereum:native | Mapa de liquidaciones en 1h
Ethereum rebota a 2.360 desde el mínimo del día 24, en 2.281. En el recorte, el máximo es 2.526.
🔻 Abajo, entre 2.150 y 2.281: queda el bloque de longs, que sigue siendo el más pesado del mapa. El núcleo, en rojo, está en 2.268, a un ~4% del precio. Hay otra franja intensa cerca de 2.220.
⚡ La caída del 24 ya consumió la parte alta del bloque y las franjas de 2.315–2.330.
🔺 Arriba:
• ~2.420: una línea fina de shorts.
• 2.500–2.520: franjas cerca del máximo del recorte.
El precio frenó justo encima del núcleo y rebotó. La mayor concentración de liquidaciones del mapa sigue intacta debajo.
El mapa no indica la dirección del precio. Muestra dónde están las posiciones apalancadas que serían liquidadas si el precio llega a esos niveles.
#ETH
🔗 tradingdifferent.com/code/rT…

Trading Different retweeted
📍 #BTC | Liquidez neta: la marea sube, pero Bitcoin no la sigue
La liquidez neta del dólar está en 5,81 billones de dólares (dato semanal del 21 de octubre, sección Macro & Liquidez de Trading Different). El indicador marca "suma liquidez".
📊 En el último año:
• La liquidez neta subió de ~5,59 a ~5,81 billones, cerca de un +4%, con picos cerca de 6 billones en abril y julio.
• El S&P 500 subió un 13% y el Nasdaq un 12%, en línea con esa suba.
• Bitcoin está un 28% abajo en el mismo período.
🔎 La desconexión:
Las acciones acompañaron la subida de la liquidez. Bitcoin quedó despegado: cayó fuerte en febrero, lateralizó en el verano boreal y recién en septiembre empezó a recuperar.
La liquidez no mueve el precio de un día para el otro, pero marca el entorno. Hoy la marea de fondo es favorable y Bitcoin todavía no la refleja.
#BTC
🔗 tradingdifferent.com/code/rT…
