

The AI revolution, in plain English
- Tweets1.6K
- Following2.3K
- Followers3.1K
- Likes451
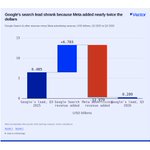




ALT Chart: Google's search lead shrank because Meta added nearly twice the dollars. Google Search & other revenue minus Meta advertising revenue, USD billions, Q3 2025 to Q3 2026. Source: Meta and Alphabet third-quarter 2026 earnings releases; Vector calculations


ALT Chart: Alphabet's capital spending has overtaken its operating cash flow. Quarterly net cash from operations vs purchases of property and equipment, USD billions, Q1 2025 to Q3 2026. Source: Alphabet earnings releases (SEC Form 8-K Exhibit 99.1), Q4 2025 and Q3 2026; Q3 2026 earnings call, as transcribed by The Motley Fool


ALT Chart: ServiceNow's contracted-revenue growth held near 21%, then guidance drops to 18.5%. Constant-currency year-over-year growth, %, by quarter-end, Q4 2025 to Q4 2026; Q4 2026 values are company guidance, not results. Source: ServiceNow quarterly earnings releases (Q4 2025, Q1–Q3 2026), via ServiceNow Newsroom and SEC Form 8-K filings


ALT Chart: Revenue nearly tripled, but gross profit stayed flat at about RMB162 million. Iluvatar CoreX group revenue split into cost of sales and gross profit, RMB million, first half 2025 vs first half 2026. Source: Shanghai Iluvatar CoreX Semiconductor interim results announcement, Hong Kong Exchanges and Clearing (HKEXnews), 28 August 2026


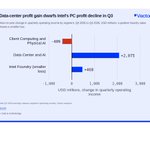
ALT Chart: Data-center profit gain dwarfs Intel's PC profit decline in Q3. Year-on-year change in quarterly operating income by segment, Q3 2025 to Q3 2026, USD millions; a positive foundry value means a smaller loss. Source: Intel Q3 2026 earnings release (segment operating results); Vector analysis

ALT Chart: Training is 13% of capacity but 70% of Ember's theoretical flexibility. Share of total, Ember's 2030 global data-center model: workload mix versus the 6.5% theoretical flexible portion, before the 48% utilization step. Source: Ember, Data centres for grids: the potential impact of flexibility (Oct 29, 2026); Vector analysis