





Pinned Tweet
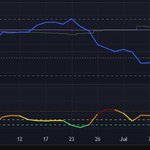
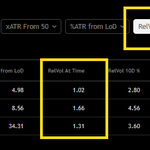
I just published another TradingView Indicator: "GreenStar Positioning Heads-Up Display" for fast colorized comparison of key entry criteria, like ATR extension from MA and distance from Low of Day ala @jfsrev , combined w/ @markminervini score, relative strength, relative volume, VCP contraction, sector/industry all at a glance.
Get it here: tradingview.com/script/vthCy… It combines an array of key values in a tight space, lots of display options, configure your own MAs and color-code criteria. Free and open source.


FlyMe2 retweeted

Celebrating my 10th Black Friday with TradingView! To mark the occasion, @tradingview is giving away 2 FREE annual subscriptions — one Ultimate and one Premium — to 2 lucky followers here. A little thank you to the community.
How to enter:
🔁 Retweet this post
📷 Follow me and @tradingview
Winners will be announced next Wednesday. Good luck! 🎁


This will mark my 8th year of Black Friday using Tradingview.
Here are 8 FREE public scripts I highly recommend exploring to refine your workflow, templates, or layouts. They’re listed alphabetically by script name:
1. **ADR% - Average Daily Range %** - By @zerokapital
tradingview.com/v/ss2QgCWi/
Use this to study the historical ADR% of securities and analyze how momentum stocks develop and build their volatility patterns.
2. **ATR% Multiple from 50-MA** - Credits to @DumbleDax
tradingview.com/v/oimVgV7e/
My favorite tool for profit-taking or extension signals in setups. It’s also helpful for index analysis to gauge when to scale back on risk exposure.
3. **EPS & Sales** - By @DumbleDax
tradingview.com/v/WiaFmLGR/
Arguably the best EPS & Sales script available. It integrates earnings, sales, beats, and guidance into your charts via table format or below price template, as seen in my trading ideas and stock update.
4. **Financials on Chart** - By @tradingview
tradingview.com/v/Lbxl9OqZ/
A fantastic on-chart display of up to 9 fundamentals (Qtr/Yr) of your choice from over 100 options, including PEG, Earnings Yield, Price to Free Cash Flow Ratio, and ROIC%. This is great for your long-term investment overview without referencing to another 3rd party website for fundamental data.
5. **Industry Group Strength** - By @amphtrading
tradingview.com/v/5NsvcOVp/
This indicator helps you pinpoint the best-performing stocks within specific industry groups. My default template lists the top 5 RS stocks from the same industry as the stock I’m analyzing. @amphtrading also offers 41+ free scripts, making him one of the most generous contributors to our TradingView community.
6. **Range Tightening Indicator** - By @Ollie_AllCaps
tradingview.com/script/yaIen…
A price-tightening indicator using a lookback period. It’s also useful for identifying the "rate of change" of potential bottoms or tops, as highlighted by Stanley Druckenmiller in his podcast with Nicolai Tangen.
7. **Simple Volume with Pocket Pivots** - By @finallynitin
tradingview.com/v/JkB0iCFp/
The most versatile volume script, in my opinion, offering extensive customization for color coding, dollar volume, RVOL, and more.
8. **Swing Data** - Credits to @DumbleDax
tradingview.com/v/uloAa2EI/
This table consolidates essential data for swing traders in a simple format, providing everything you need to improve trading execution & efficiency.
If you found this post helpful and valuable, consider retweeting🔁to spread the words to support their efforts and encourage future updates and enhancements.
I hope these scripts will prove beneficial on your trading journey.

FlyMe2 retweeted
This will mark my 8th year of Black Friday using Tradingview.
Here are 8 FREE public scripts I highly recommend exploring to refine your workflow, templates, or layouts. They’re listed alphabetically by script name:
1. **ADR% - Average Daily Range %** - By @zerokapital
tradingview.com/v/ss2QgCWi/
Use this to study the historical ADR% of securities and analyze how momentum stocks develop and build their volatility patterns.
2. **ATR% Multiple from 50-MA** - Credits to @DumbleDax
tradingview.com/v/oimVgV7e/
My favorite tool for profit-taking or extension signals in setups. It’s also helpful for index analysis to gauge when to scale back on risk exposure.
3. **EPS & Sales** - By @DumbleDax
tradingview.com/v/WiaFmLGR/
Arguably the best EPS & Sales script available. It integrates earnings, sales, beats, and guidance into your charts via table format or below price template, as seen in my trading ideas and stock update.
4. **Financials on Chart** - By @tradingview
tradingview.com/v/Lbxl9OqZ/
A fantastic on-chart display of up to 9 fundamentals (Qtr/Yr) of your choice from over 100 options, including PEG, Earnings Yield, Price to Free Cash Flow Ratio, and ROIC%. This is great for your long-term investment overview without referencing to another 3rd party website for fundamental data.
5. **Industry Group Strength** - By @amphtrading
tradingview.com/v/5NsvcOVp/
This indicator helps you pinpoint the best-performing stocks within specific industry groups. My default template lists the top 5 RS stocks from the same industry as the stock I’m analyzing. @amphtrading also offers 41+ free scripts, making him one of the most generous contributors to our TradingView community.
6. **Range Tightening Indicator** - By @Ollie_AllCaps
tradingview.com/script/yaIen…
A price-tightening indicator using a lookback period. It’s also useful for identifying the "rate of change" of potential bottoms or tops, as highlighted by Stanley Druckenmiller in his podcast with Nicolai Tangen.
7. **Simple Volume with Pocket Pivots** - By @finallynitin
tradingview.com/v/JkB0iCFp/
The most versatile volume script, in my opinion, offering extensive customization for color coding, dollar volume, RVOL, and more.
8. **Swing Data** - Credits to @DumbleDax
tradingview.com/v/uloAa2EI/
This table consolidates essential data for swing traders in a simple format, providing everything you need to improve trading execution & efficiency.
If you found this post helpful and valuable, consider retweeting🔁to spread the words to support their efforts and encourage future updates and enhancements.
I hope these scripts will prove beneficial on your trading journey.
Another great tool from @ETFbreakouts

My Risk On / Risk Off indicator turned red on September 10 and has stayed red ever since. The first warning came August 31, when it flipped to Caution and stayed there through September 9.
With @Muninn’s study making the rounds this morning, I’m sharing the TradingView indicator I use to see how many of the major indexes are trending together.
I track $IXIC, $SPX, $IWM and the NYSE Composite (base:0x38f9bf9dce51833ec7f03c9dc218197999999999). Each gets one vote when its daily 10 EMA is above its 21 EMA.
4 of 4 → Green · Risk On
3 of 4 → Yellow · Caution
0–2 of 4 → Red · Risk Off
All four symbols are adjustable. I trade enough semis that I’m considering replacing either $IWM or base:0x38f9bf9dce51833ec7f03c9dc218197999999999 with $SOXX. I’d like to see how often that actually changes the signal.
I use it in the same pane as my VCP Tightness Score, but you can put it directly on your price chart or in a pane you already use.
tradingview.com/script/MPypF…
Do you use @deepvue? I’m bringing both this indicator and my VCP Tightness Score to DeepVue soon. I’ll post here when they’re available.
@RichardMoglen


2
766
FlyMe2 retweeted
I just published another TradingView Indicator: "GreenStar Positioning Heads-Up Display" for fast colorized comparison of key entry criteria, like ATR extension from MA and distance from Low of Day ala @jfsrev , combined w/ @markminervini score, relative strength, relative volume, VCP contraction, sector/industry all at a glance.
Get it here: tradingview.com/script/vthCy… It combines an array of key values in a tight space, lots of display options, configure your own MAs and color-code criteria. Free and open source.
FlyMe2 retweeted

What’s happening in the market right now is absolutely wild.
For long-term or new investors, this is where I would consider starting to dollar-cost average (DCA) into ETFs like $VOO and $VGT. (NFA)
For swing and position traders, this is the kind of environment where staying in cash and waiting for market confirmation can make sense, as the trading books teach us.
I also like quality names like $MSFT $META $AMZN $GOOGL $NVDA, but I prefer accumulating gradually rather than going all in.
Nobody knows where the bottom is. There’s no need to rush or blindly buy every dip in a downtrend.
My personal suggestion: I’m sure many of us have made mistakes during this correction, and that’s okay. What matters is recognizing those mistakes, writing them down, and making a promise to yourself not to repeat them.
The market will give you another opportunity. Make sure you’re still in the game when it does.
Not financial advice. Just sharing my personal perspective.
FlyMe2 retweeted

Whats nice for new investors is that they get to see all 4 stages in just 6 months 😭😭


FlyMe2 retweeted

A few things trading and life have taught me over the years. Some lessons were a lot more expensive than others.
1. The more you trade, the less you often make. Trading for entertainment is one of the most expensive hobbies you can have.
2. If you're going to trade stocks, learn technical analysis before you fall in love with a company's story.
3. Never enter a trade without knowing where you're wrong. Planning your trade is not optional.
4. Make a habit of learning something new every week. You don't need to know everything, but you should never stop improving.
5. If your mind is constantly racing, sit quietly with your eyes closed for 15 minutes every day for a week. You'd be surprised how much noise you're carrying around.
6. Making a wrong decision is perfectly fine. Continuing to make the same wrong decision while expecting a different result is not.
7. Markets change. Technology changes. But human behaviour barely changes. Fear and greed have been moving markets for generations.
8. Your boss is not automatically your friend. You're exchanging your time, knowledge and services for money. Understand what your time is worth.
9. Everything you do has a cost. Sometimes it's money, sometimes it's time, and sometimes it's your peace of mind.
10. Teach your kids about money early. How to save, invest, manage risk and let time work for them. These lessons can change their lives.
11. Cash is a position too. You don't have to be all-in every single day to make money in the market.
12. Being right about a stock means very little if your position sizing is so bad that one mistake wipes out months of progress.
13. Stop comparing your results with people who have completely different circumstances, capital and risk tolerance.
14. Learn to do nothing. Not every day needs a trade, not every opportunity needs your money, and not every problem needs an immediate reaction.
15. Your next 10 years will depend on what you're doing today.
16. And finally, something I wish more people understood:
Compounding works both ways.
You can compound wealth, knowledge, discipline and good habits.
Or you can compound debt, losses, bad decisions and regret.
Be very careful what you're allowing to compound in your life.

With swing trading, it helps to be a fisherman. The wind has kept me home lately. I don't go out casting anyway into howling winds and pounding surf, I fix my reels, tie my rigs, plan and learn and invent, literally mend my nets and look at what I can do to improve the next trip.
1
182
FlyMe2 retweeted
Want to know how to avoid major drawdowns and improve your returns in the stock market?
Understanding Stan Weinstein's Stage Analysis is a great place to start. Every stock moves through 4 stages!
One of the most important lessons I've learned from Stan Weinstein's Stage Analysis is understanding where a stock stands in its market cycle and when to buy, hold, reduce exposure, or stay away.
The framework primarily uses the 30-week moving average (roughly equivalent to the 150-day SMA), price action, volume, and relative strength.
Stage 1: Basing / Accumulation
What does it look like?
- Usually forms after a prolonged Stage 4 downtrend
- Stock stops making consistent lower lows and starts trading sideways
- 30-week moving average begins to flatten
- Price moves above and below the flattening moving average
- Selling pressure decreases, and volume often dries up
What does it mean?
- The stock is trying to establish a bottom, but buyers haven't taken full control yet. This is where I start building my watchlist and looking for improving technicals, higher lows, and signs of accumulation.
- Remember, a stock falling 50-70% doesn't automatically make it a Stage 1 base. It needs time to stabilize and build a proper structure.
Stage 2: Advancing/Uptrend
What does it look like?
- Stock breaks out above its Stage 1 base
- Breakout ideally happens on expanding volume
- 30-week moving average starts sloping upward
- Higher highs and higher lows
- Relative strength improves against the broader market
What does it mean?
- Buyers are taking control, and institutional accumulation may be supporting the uptrend.
- This is my favorite stage to own growth stocks! I generally look for Stage 1 → Stage 2 breakouts and constructive pullbacks to rising moving averages.
- The goal isn't to buy at the absolute bottom but to participate when the stock starts showing evidence of a sustainable uptrend.
Stage 3 vs. Stage 4 - This is where a lot of us make mistakes!
Stage 3: Topping / Distribution
What does it look like?
- Usually forms after a prolonged Stage 2 advance
- Momentum slows, and price starts moving sideways
- 30-week moving average begins flattening
- Price repeatedly crosses above and below the moving average
- Breakouts start failing, and selling volume may increase
- Major support levels are still holding
What does it mean?
- The previous uptrend is losing momentum, and the stock may be going through distribution.
- Stage 3 doesn't automatically mean a crash is coming. Some stocks consolidate and resume their uptrends.
- For me, this is where I become cautious, tighten risk management, consider trimming positions, and avoid aggressively adding exposure.
Stage 4: Declining / Downtrend
What does it look like?
- Stock breaks below major support or its Stage 3 range
- 30-week moving average starts sloping downward
- Price trades below the declining moving average
- Lower highs and lower lows
- Short-term rallies often fail near declining moving averages
What does it mean?
- Sellers are in control, and the stock is in a downtrend.
- One of the biggest lessons I've learned is that technicals often reveal weakness before fundamentals do.
- A company can continue reporting strong earnings while its stock is entering Stage 4 because the market is already pricing in future expectations.
The biggest difference between Stage 3 and Stage 4:
Stage 3 = Sideways price action, flattening moving averages, potential distribution.
Stage 4 = Support breakdown, declining moving averages, established downtrend.
Another important thing to understand is that Stage 1 and Stage 3 can look very similar!
Both involve sideways price action and flattening moving averages. The difference is what happened before:
- Sideways consolidation after a prolonged decline could be Stage 1.
- Sideways consolidation after a major advance could be Stage 3.
My approach is simple:
Stage 1 - Build your watchlist and prepare.
Stage 2 - Look for opportunities to participate.
Stage 3 - Protect your gains and manage risk.
Stage 4 - Protect your capital and avoid weak downtrends.
Stage Analysis isn't perfect, but it's one of the most valuable frameworks I've learned in my investing and trading journey.
I use technicals to understand WHEN to participate and fundamentals to understand WHAT I'm buying.
Understanding these four stages can make a tremendous difference in how you navigate market cycles!
🤖 Made with AI

FlyMe2 retweeted

I am pretty tired of all the "breadth is improving bros" and I want to show you what I am seeing.
As always things can change, mend, news, tacos, FOMC can improve things, this is a day by day assessment.
BUT everyone saying this is normal rotation and things are improving are smoking something or actively denying what is happening under the hood.
Lets have a look at a couple of things, this is a long one.🧵
1. Lets start with the simple stuff, I think both the 2024 top and the 2015-2016 market is similar to now, lets look at the pre-tariff decline.
Same pattern, roughly the same chop time. We see trend fatigue as the 50 SMA no longer gives bounces. And if the 50 SMA can't attract buyers, you need buyers lower down -- a first cautionary sign.
We also see the low volume when we top, always a bad thing to see -- there is no committed buyers at higher prices.
2. Small caps losing and living under the 200 SMA is a huge signal, everyone is taking it way too lightly. Only one time since the 2022 bear market has seen small caps living under the 200 SMA.
And just like now small caps topped before the market and was down about 10% when the decline in the S&P 500 started.


FlyMe2 retweeted
New market breadth display by @TradingView, just released today. It covers market breadth across countries and, best of all, it’s free for all users.
i.e.
USA: tradingview.com/markets/stoc…
India: tradingview.com/markets/indi…
Singapore: tradingview.com/markets/stoc…

This is my free EOD breadth level panel on @tradingview — you can use the same ticker to build your own, there are much more options but I always have mine based on traditional MA value.
Breadth absolutely deserves a place in your trading system, and I couldn’t agree more. When used right, it’s incredibly powerful — especially when you combine with a thorough screen of sectors and industry groups showing relative strength. One important nuance I want to highlight: relative strength isn't just about securities outperforming the benchmark on the surface. It also emerges from names that show the least weakness during prolonged down moves. That resilience matters, and that itself will be a upturning RS on a line chart based indicator.
To consistently spot these opportunities, routine is everything. Regardless of what the market throws at you, your process has to stay intact — it’s what anchors your emotional discipline. Don't shut off yourself from market because of capitulation days, you should actually put even more time to mutiple screening to sieve out names for your watchlist.
P.S. If the market gives us one more round of capitulation, I’m genuinely excited about the potential long bias setups that could follow. ES Futures at asia open now has already gapped down but with potential doji star to close (indecision candle), and reduced volatility going forward can build the second bear flag for April.

FlyMe2 retweeted

VCP Tightness Score v2.0 - #MRNA TradingView tradingview.com/script/vvEJg…
I've updated my VCP Tightness score. This version give more weight to tight daily or weekly closes.
Tight weekly closes was something William O'Neill stressed.
Overall you won't notice a difference, except when weekly closes are very tight.

A spot-on Sunday read from @corymitc:
"He stopped judging himself by whether a trade made money, and started judging himself by whether he followed a sound process." ...and ... "He became something better: a trader who could survive and thrive in uncertainty." Worth a few mins:

Story of How a Trader Improved by Embracing Uncertainty, NOT Prediction tradethatswing.com/story-of-…


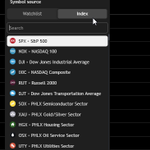
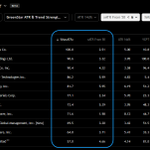
New Pine Screen option in TradingView allows screening against any major index! (Until now, it only worked on a user's watchlist.) This opens up even more options for using the "ATR & Trend Strength Screener": tradingview.com/script/DTJ5b… @jfsrev

New Pine Screen option in TradingView allows screening against any major index! (Until now, it only worked on a user's watchlist.) This opens up even more options for using the "ATR & Trend Strength Screener": tradingview.com/script/DTJ5b… @jfsrev
tradingview.com/script/DTJ5b…
This is the updated link with several new columns / filters added. (I had to update my description for TV mods, which means a new URL.) My other scripts are/will be here tradingview.com/u/FlyMe2/

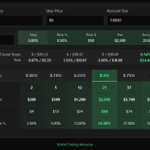
I created a stop-loss and risk calculator to visualize the principles of risk-based position sizing: teapawt.org/2FlyMe2/status/2095714…