
I am a newbie crypto and forex trader. I’m always looking to learn new strategies and maybe explore other ways of trading. Goal is to become a day trader.
Joined May 2019
- Tweets1.6K
- Following337
- Followers100
- Likes760





Join me on the Jumper waitlist. waitlist.jumper.xyz/r/JMP-6B…

2
10
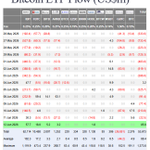
ETF flow Aug 10-14: rough stretch, 4 of 5 days net negative (-$144.6M, +$7.8M, -$61.1M, -$131.1M). COT tells a different story though: spreading (1,695→1,958) and open interest (20,143→21,185) both resumed climbing — confirms last week's roll thesis, not an unwind.
Zooming out: this fits the bigger pattern several analysts are watching. BTC topped $126K Oct 2025 (right on historical cycle timing per @benjamincowen ), now ~50% off highs. @benjamincowen , @PeterLBrandt , @100trillionUSD , @glassnode all clustering around Q4 2026 (Oct specifically) for the cycle bottom — consistent with prior bottoms in 2014, 2018, 2022, all midterm years. Brandt's range: $40-50K.
Not a certainty — post-ETF dynamics are a real challenge to the old cycle framework, and even @benjamincowen says the call could be wrong. But the current outflow chop lines up with what a distribution/capitulation phase looks like.
Data: @FarsideUK, CFTC TFF #133741
33
CFTC COT (BTC, CME #133741) Aug 4: spreading fell hard after 5 straight weeks building (2,750→1,695, -1,055). Net short deepened slightly (-6,873→-7,240) while the hedge leg shrank — that combo reads more like directional short exposure than basis-trade building.
Real story this week: Other Reportables made the biggest single move on the board, net position +836→+2,149 (+1,313). Dealers absorbed it, pulling back from +4,080 to +2,969.
Meanwhile ETF flow tells a genuinely strong story: Aug 3-6 all positive, $170M/$212M/$244M/$138M, IBIT contributing solidly every day. Spot/ETF demand looks real — just not showing up as a basis-trade signature in futures right now.
Data: CFTC TFF #133741, @FarsideUK
34
CFTC COT (BTC, CME #133741) Jul 28: first OI decline in 5 weeks (20,527→20,019, -508). Leveraged funds cut both longs (-747) and shorts (-1,823), while spreading kept climbing (+522, 5th straight week).
Likely explanation: monthly contract expiry. CME BTC futures expire last Friday of the month — Jul 31 this cycle, just 3 days after this snapshot. Basis trades built earlier in the contango cycle naturally close/roll into the next contract as futures converge to spot at settlement. Falling OI + falling outright positions + still-rising spreading (rolling into new contract) is the textbook signature of a roll, not an unwind.
Can't confirm directly — COT doesn't break out by contract month — but the timing fits too well to be coincidence. Watching next week's print: if OI and spreading both resume climbing, roll thesis confirmed.
Data: CFTC TFF #133741
27
IBIT: -$8.8M → -$54.8M → +$89.8M (Jul 27-29). Flip tracks almost exactly with the US-Iran mutual pause holding — Brent fell ~7% ($100→$83) as strikes stopped, BTC reclaimed $65K. Fed held rates steady Jul 29 (3 officials wanted a hike, but no surprise).
Good outcome from not overreacting to the Jul 23-24 selloff — that was clearly panic on the escalation, not a structural flow break, and it unwound fast once the pause held.
But: today (Jul 30) Iran fired ballistic missiles at US troops, all intercepted, Trump vowing to respond "hard." Oil spiking again (+6-8%), Dow -2.2%, Nasdaq 3-month low. BTC holding near $64K so far — read as resilience, not confirmation the pause survives.
Clarity Act odds actually fell to 35% on Polymarket yesterday, still no Dem movement.
Waiting for tomorrow's actual ETF print before drawing conclusions. Data: @FarsideUK
54
IBIT selling nearly stopped: -$202.5M, -$212.2M (Jul 23-24) → just -$8.8M (Jul 27). Still 3 negative days technically, but the magnitude collapse is the real story.
Driver: US and Iran are now on a 3rd straight day of mutual pause in strikes, both sides giving diplomacy "space" per Trump. That's a real, confirmed de-escalation — matches the timing of selling drying up almost exactly.
NOT the driver (yet): Clarity Act. As of Jul 27, seven Dem senators still say the revised text "falls short." GOP is seeking their votes, not receiving them. Republicans (53 seats) remain short of 60, and even 2 GOP votes (Hawley, Paul) are unconfirmed. No swing has happened — worth watching this week's potential cloture filing, but crediting it now is premature.
Data: @FarsideUK
1
22

IBIT streak snapped: -$202.5M (Jul 23), -$212.2M (Jul 24), after 7 straight green days.
Why: Trump told Axios he's considering a "massive attack, bigger than ever before" on Iran after Houthi strikes on Saudi tankers. 13+ nights of US strikes near Hormuz. Brent broke $100 for the first time since May, 10Y yield near 4.7%, S&P -1.2%, Nasdaq -2.2%. Real risk-off, not noise.
Clarity Act isn't just stalling — it's specifically stuck on Trump's OWN crypto conflicts. He holds WLFI exposure, disclosed $1B+ in crypto income last year. Democrats (Warren, Murphy, Merkley) want a real ethics/divestiture requirement; the current draft lets existing ventures continue and expires in 2029. That's the actual holdup.
COT still intact though: spreading rose again Jul 21 (1,745→2,228), 4th straight week, basis-trade thesis unaffected by the selloff.
Data: @FarsideUK, CFTC TFF #133741
120
BTC and ETH exchange supply just hit multi-year lows (~6.6% and ~4.3% of total supply, per Santiment) — most of the float is now locked in ETFs, treasuries, and staking.
Thinner float = thinner order books. Good news hits harder (less supply to absorb buying → sharper rallies). Bad news hits harder too (less liquidity to absorb selling → sharper drops).
Doesn’t pick a direction. Just turns up the volatility.
1
11
IBIT: 7th straight green day (Jul 22, +$38.8M), but a big step down from +$163.9M the day before. Still positive, streak intact, just way less conviction.
Why: no single bearish catalyst, more a pause-and-digest day. Weaker yen, rising oil, renewed inflation worries, and traders sitting on hands ahead of Alphabet/Tesla earnings after the bell — big tech prints acting as a risk-appetite barometer. BTC itself was flat-to-down (-0.7%).
A Clarity Act headline (Senate Republicans revised the bill) made the rounds too, but passage odds are still shaky per our last look — more noise than catalyst.
Total ETF flow: $69.1M, third straight day of moderating (not reversing) totals.
Data: @FarsideUK
14
IBIT: 6 straight green days (Jul 14-21): 138.9 → 80.8 → 33.4 → 136.5 → 116.5 → 163.9. Day 6 is the highest print of the whole streak.
Total ETF flow $203.2M on Jul 21, third straight day above $130M. ARKB (+$9.7M) and FBTC (+$23.1M) still contributing alongside IBIT. GBTC remains the only consistent drag (-$45.4M cumulative drag this stretch).
Well past our 3-day threshold, pattern still "mixed" (not decaying) — the historically strongest bucket in our backtest. 6 days in, still inside the 10-day confirmation window but this is the strongest version of the signal we've tracked yet.
Data: @FarsideUK
9
IBIT: +$138.9M → +$80.8M → +$33.4M → +$136.5M (Jul 14-17). 4 days green, one better than our 3-day threshold.
More important: day 4 broke the decaying pattern. Last week this streak looked like the historically weak shape (decreasing magnitude, 0-for-2 in our backtest). The rebound flips it to "mixed" — the bucket that went 5-for-5 confirmed across 10 historical setups since Jan 2024.
This now lines up with the COT data too: 3 straight weeks of rising spreading (436→1,219→1,745), consistent with basis-trade capital flowing back in. Flow and futures positioning telling the same story.
Not calling it fully confirmed yet — still early in the 10-day window — but this is a real upgrade from a weak signal to a strong one.
Data: @FarsideUK, CFTC TFF #133741
16
CFTC COT (BTC, CME #133741), 3 weeks running:
Spreading: 436 → 1,219 → 1,745 (quadrupled)
Net short (leveraged funds): -5,313 → -6,717 → -7,491
Open interest: 18,336 → 18,832 → 19,385 (new capital, not rollovers)
Spreading and net short climbing together, every week, for 3 weeks straight. That's the signature of basis-trade rebuilding (long spot/ETF + short futures hedge), not a bearish directional bet. If it were pure conviction shorting, spreading would stay flat while net short rose — it's not.
Bonus: Other Reportables flipped from net -978 to net +246 over the same stretch. Sentiment outside leveraged funds turning more constructive too.
Data: CFTC TFF #133741
29
IBIT: +$138.9M → +$80.8M → +$33.4M (Jul 14-16). 3 straight green days, our reversal threshold met.
But: magnitude is decaying each day. So I backtested every 3+ day IBIT streak since Jan 2024 that followed a net-outflow stretch (10 comparable setups found).
Result: streaks with DECREASING day-to-day magnitude (like this one) were 0-for-2 historically — both prior cases (Mar 2025, Dec 2025) reversed back to net outflow within 10 trading days. "Mixed" patterns went 5-for-5 confirmed. "Increasing" was 1-for-2.
Overall base rate: 6/9 (67%) of setups confirmed. But this one's shape (decaying) is the one bucket that's failed every time so far. Small sample, not a law of nature — but the technical box is checked without the momentum to back it up.
Data: @FarsideUK
18
IBIT: +$138.9M (Jul 14) → +$80.8M (Jul 15). 2 days green, one more to hit our reversal threshold.
Driver is the same both days: rate-cut expectations easing after Tuesday's soft CPI print (core flat 0% m/m). BTC pushed through $65K Jul 15, a 3-week high.
Secondary tailwind: Japan's Upper House committee cleared a spot BTC ETF bill — reclassifying crypto as a "financial instrument," flat 20% tax, potential Tokyo listing by 2027. Longer-horizon, not a today-mover, but adds to sentiment.
Note: this is still one underlying catalyst (CPI) driving both days, not two independent confirmations. Watching for day 3.
Data: @FarsideUK
20
IBIT +$138.9M, total ETF flow +$181.1M on Jul 14. Bounce, not a reversal — Jul 13 was still -$424.7M.
Driver was the CPI print, not Warsh. June CPI: 3.5% y/y (down from 4.2%), core flat at 0% m/m, well below the hot print Wall St was bracing for. 30yr yield pulled back from above 5%. That's what moved flow.
Warsh's testimony same day gave nothing dovish — no forward guidance, "no tolerance for persistently elevated inflation," reaffirmed the 2% target, called the CPI improvement "not mission accomplished." Hawkish-neutral, not a catalyst.
So: data-driven relief bounce, policy tone unchanged. Doesn't meet the bar for a reversal call yet (need 3 consecutive IBIT-positive days). Watching.
Data: @FarsideUK
32

BTC ETF flow Jul 13: -$424.7M (IBIT -185.5, FBTC -245.6). One of the heavier outflow days since the June stretch.
Likely driver: Trump declared the US "Guardian of the Strait of Hormuz," announced a 20% fee on all cargo transiting it, and reimposed the naval blockade on Iran — alongside heavy new US strikes and Iran hitting Bahrain, Jordan, Kuwait, and Oman in retaliation. The mid-June ceasefire framework is effectively dead.
This is a real risk-off shock (active multi-country conflict + a literal toll on global trade), not a crypto-specific story. Oil up, equities down, BTC down — classic broad correlation.
Whale data today doesn't offset it either — net BTC flow into exchanges, same direction as the outflow, not against it.
Data: @FarsideUK, @whale_alert
49
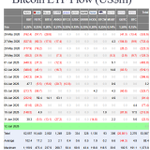
10 weeks of US spot BTC ETF net flow (chart attached):
May 18-22: -$1,256.3M
May 26-29: -$1,415.6M
Jun 1-5: -$1,722.0M (worst week)
Jun 8-12: -$319.3M
Jun 15-18: -$227.5M
Jun 22-26: -$1,787.3M (2nd worst)
Jun 29-Jul 2: -$526.1M
Jul 6-10*: +$110.6M
5 straight brutal negative weeks (mid-May through late June), then two weeks of sharp moderation, now the first positive week in this stretch. Not calling a trend yet , but the shape of the reversal is visually clean.
Data: @FarsideUK

15
CFTC COT (BTC, CME #133741) week of Jul 7 vs Jun 30:
Leveraged funds net position: -5,313 → -6,717 (MORE short, -1,404)
Spreading: 436 → 1,219 (nearly 3x, +783)
BTC was UP this week. A pure directional short bet getting squeezed by a rally would show short-covering, not more shorts. Instead we got more shorts AND more spreading simultaneously — that's the signature of basis-trade rebuilding (long spot/ETF + short futures for carry), not a bearish bet.
Other Reportables, last week's bears, retreated hard (-978 → -164). Dealers and asset managers both got more long.
Lines up with ETF flow turning tentatively positive this week. Watching spreading as the tell — if it holds/climbs alongside net short, this is arb capital returning, not fresh bearish conviction.
Data: CFTC TFF #133741
1
33