

Football data, visualized ⚽📊 Compare players, create radars, pizza charts and scatter plots. Turn stats into stories with FBPlot.
Joined August 2026
- Tweets31
- Following1
- Followers76
- Likes88






🌳 vs 🩵
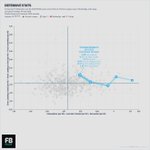
Delap vs Haaland ahead of Forest–City today
⚽ Delap
◉ 0.15 goals per 90 from 0.38 xG
◉ 12.5% of his shots on target
◉ 3.64 shots p90
⚽ Haaland
◉ 0.99 goals p90 from 0.65 xG
◉ 47% of his shots on target
◉ 3.74 shots p90

But Delap does more for the team ⤵️
◉ 1.21 key passes per 90 (Haaland: 0.55)
◉ 2.43 ball recoveries (Haaland: 1.87)
Compare any two players at fbplot.com



FBPlot retweeted
90 people joined FBPlot this week. Still can't quite believe it🙀
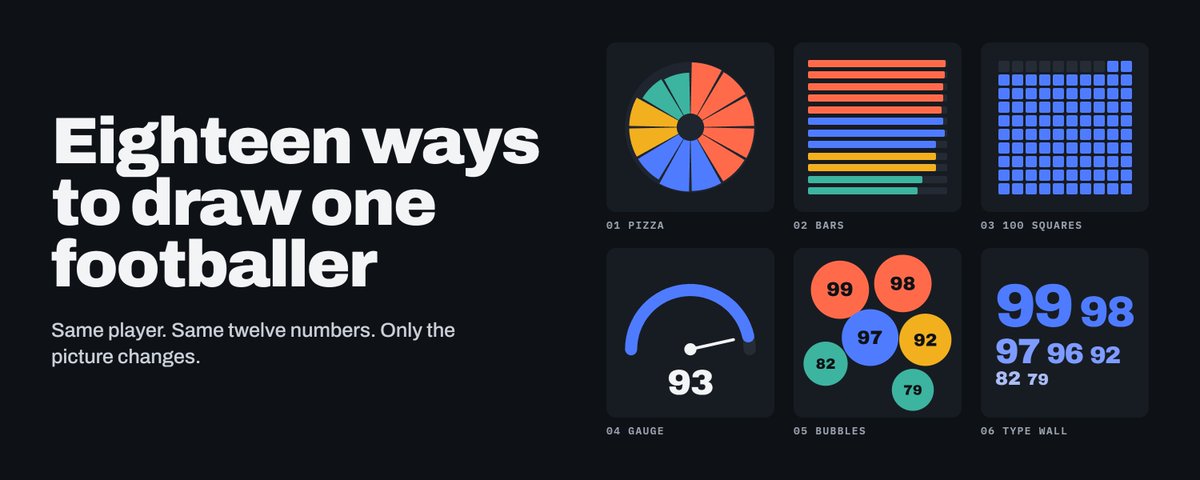
I've spent a lot of time redesigning every chart. Same data, 37 designs: profiles, head-to-heads, even an 8-second video version.
Thanks for the support 🙏 Reply with a player and I’ll send you their chart.

Your player. Your colours. Your style.
20 player profile designs in @FBPlotApp: Signal, Player card, 100 squares and more.
Customise the look and find the visual that brings your football story to life.
fbplot.com


FBPlot retweeted
Transfer Deadline Day is always a good stress test for a football scouting tool.
Yesterday the summer window closed across Europe’s big five leagues, and activity on FBPlot.com jumped with it.
More people searching, comparing and visualising players when the market was at its busiest. 📈

FBPlot retweeted
Stop treating every completed pass as equally valuable.
A lot of passing analysis still rewards volume:
- more completed passes = more influence
-more connections = greater importance
Useful, but incomplete.
10 safe CB-to-CB passes can dominate a conventional passing network.
3 line-breaking passes that move the ball into dangerous areas may matter far more.
A 2026 paper tackles this with a Valued Passing Network (VPN).
Instead of weighting connections only by frequency, it weights them by the Expected Threat (xT) they create.
So the question changes from:
“Who passed to whom the most?”
to:
“Which passing relationships actually generated threat?”
Using the 2022 World Cup, the authors compared conventional passing networks with xT-weighted ones. The valued network showed stronger relationships with player ratings, particularly for midfielders and forwards.
The figures make the distinction clear.
A conventional network is good at showing structure and circulation.
A valued network highlights which connections actually increase attacking threat.
That helps separate:
- volume from impact
- involvement from contribution
- circulation from progression
- safe possession from threat creation
And the World Cup final example is especially interesting: some players who look central in the conventional network become less prominent once passing value is considered, while players such as Messi, Mbappé and Griezmann gain relative importance.
This doesn’t mean safe or backwards passes are bad. They can be tactically essential.
It means that a completed pass is not automatically a valuable pass.
For scouting, that leads to better questions:
- Which midfielders generate value rather than simply accumulate touches?
- Which player combinations consistently move possession into dangerous states?
- Who looks average by passing volume but becomes important when contribution is considered?
Pass volume ≠ pass value.
A player can be central to circulation without being central to threat creation.
Ideally, we should measure both.


FBPlot retweeted
One of the rarest skills in football analytics is translation.
A scout sees a movement.
A data analyst sees a pattern.
A coach sees a solution.
A journalist sees a story.
The valuable person can move the same insight between all four worlds without flattening it.
Football analytics is translation before it is mathematics.

ALT Football play transforming into data, tactics and written analysis.
Atlético are signing a centre-back built around anticipation, disruption and front-foot defending.
In 2,575 Premier League minutes in 2025/26, Cristian Romero averaged:
• 1.26 interceptions per 90
• 0.17 last-man tackles
• 4.30 recoveries
• 1.43 fouls committed


FBPlot retweeted
The Article has been well received, I have added 3 more community-built football analytics tools added to the list 👇
🧭 @scout52app — scouting reports & recruitment workflows
🔎 @FBScoutEngine — large-scale player discovery
⚽ @DatoFutbol_cl — xG calculator for any set of shots @ismaelgomezs
44 tools now. Still growing.
This quoted post is unavailable.