

I like football stats ⚽ & charts 📈 Create yours with free tools: 🕸️ Pizza charts https://teapawt.org/t.co/BiQkIqlINf 📊 Bar charts https://teapawt.org/t.co/gfwoadOGlD
Chart football data →
Joined October 2025
- Tweets576
- Following127
- Followers600
- Likes1.3K
Pinned Tweet
I've been working on new features for @FBPlotApp!
The latest update brings a new landing page and fresh chart designs to help you turn football data into visuals worth sharing.
Take a look: fbplot.com


Love this chart format! 📊
Such a simple and visual way to compare the same player across different seasons.
You can spot changes in their playing style at a glance.
Really effective!


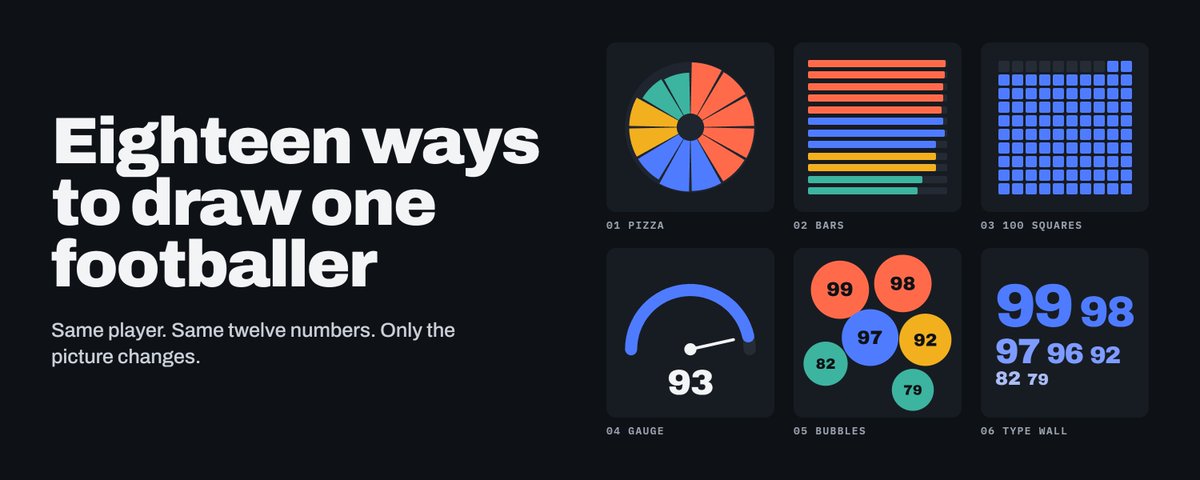
I've made a lot of pizza and radar charts. At some point I started wondering if I was just drawing them out of habit.
So I took one player and drew him 18 different ways to see what each chart actually shows, and what it hides.
Wrote up what I learned 👇


Al Maxgo retweeted
Your player. Your colours. Your style.
20 player profile designs in @FBPlotApp: Signal, Player card, 100 squares and more.
Customise the look and find the visual that brings your football story to life.
fbplot.com


Tottenham are getting into dangerous situations. They’re just not turning them into danger.
The charts in this excellent analysis by @BassTunedToRed make the problem very clear:
• 46 completed take-ons — most in the PL
→ only 5 ended in a shot or chance created
• 34 high turnovers — 4th-most
→ only 2 ended in a shot (5.9% vs 19.9% league average)
• 119 touches in the opposition box
→ 3.97 touches per box shot — highest in the league
The charts are a great reminder that volume metrics need context.
Getting into dangerous areas ≠ creating danger.
Source: The Guardian / Andrew Beasley
Link to the news in comments


The World Cup doesn’t just change player reputations. It can change their market visibility almost overnight.
267 players from the 2026 World Cup changed clubs this summer, generating $3.3bn+ in transfer fees across 47 nationalities.
For scouts, tournament performance is data.
Tournament exposure is also a market variable.
Source: FIFA International Transfer Snapshot 2026 inside.fifa.com/transfer-sys…

Al Maxgo retweeted

FBPlot by @al_maxgo just joined Launch Llama
Professional football data visualization and pizza charts
💰 Upvotes: 38
👆 Give them an upvote on Launch Llama
🏷️ Categories: Analytics, Design Tools, SaaS
tools.launchllama.co/product…
Been testing the new FBPlot search workflow quite a lot this week.
This is what it looks like in practice: define the player pool, add performance criteria, rank it with a transparent/customizable scoring model, inspect the score breakdown, and explore the results on the globe.
A lot of this started from one user request.
One of the things I enjoy most about building @FBPlotApp is when a user asks for something that ends up improving the product for everyone.
A user recently asked for a better way to search and shortlist players, so I’ve been spending quite a bit of time on the Search functionality.
You can now:
- filter by season, minutes, age, height, competition, position, team and nationality
- add performance-based conditions
- rank the resulting cohort with a scoring model
- inspect the full score breakdown for every player
- switch between the player list, birthplace map and current-club map
- save searches and revisit them later
I’ve also put a lot of emphasis on making the scoring transparent.
Instead of showing a black-box number, FBPlot exposes the metrics used, their normalized values, weights and contribution to the final score.
And for Pro users, the weighting system can be personalized, so the ranking can reflect a specific scouting model, role or recruitment philosophy rather than a fixed definition of what a “good player” is.
The score is calculated relative to the current filtered cohort too, so changing the search changes the context of the evaluation.
Still refining it, but this is getting much closer to the scouting workflow I had in mind for FBPlot.
A good reminder that some of the best product ideas come directly from users.


One of the things I enjoy most about building @FBPlotApp is when a user asks for something that ends up improving the product for everyone.
A user recently asked for a better way to search and shortlist players, so I’ve been spending quite a bit of time on the Search functionality.
You can now:
- filter by season, minutes, age, height, competition, position, team and nationality
- add performance-based conditions
- rank the resulting cohort with a scoring model
- inspect the full score breakdown for every player
- switch between the player list, birthplace map and current-club map
- save searches and revisit them later
I’ve also put a lot of emphasis on making the scoring transparent.
Instead of showing a black-box number, FBPlot exposes the metrics used, their normalized values, weights and contribution to the final score.
And for Pro users, the weighting system can be personalized, so the ranking can reflect a specific scouting model, role or recruitment philosophy rather than a fixed definition of what a “good player” is.
The score is calculated relative to the current filtered cohort too, so changing the search changes the context of the evaluation.
Still refining it, but this is getting much closer to the scouting workflow I had in mind for FBPlot.
A good reminder that some of the best product ideas come directly from users.