

"Foresee the Data. Index the move." On-chain evidence over hype @ForeDex_Proof Founder @mignoletkr TG : https://xitter.cf/t.co/0qFY3C9ByC
Global
Joined April 2026
- Tweets2.3K
- Following132
- Followers1.7K
- Likes1.8K





Pinned Tweet
🗳️ Day 7 of Voting - One Week In, Let's go! 🙌
🚀 ForeDex founder @mignoletkr has been nominated for the 2026 BINANCE THE BLOCKCHAIN 100 in the Content Creator – Best Longform Creator category!
We're cheering him on and hoping he makes it into the final Blockchain 100! 🎉
✅ The competition is heating up, and every single vote counts!
🗳️ It's Day 7 of voting! Already voted six times? Let's make it seven! 😄
Remember, you can vote for @mignoletkr once every day, so don't miss today's chance to support him! 🙏
One week down, and we're still aiming for the final 100!
A big thank you to everyone who's been voting and supporting us all week! ❤️
👉 binance.com/en/square/blockc…

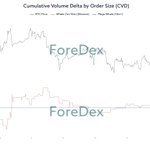
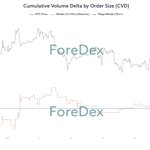
Daily ForeDex CVD by Order Size (Spot) Snapshot 📸
🔸 Whales and Mega Whales Only
🔸 Based on a 1 month period (1M)
1. Binance: No Change ➖
2. Bybit: No Change ➖
3. Bitfinex (USD): No Change ➖
4. Bitfinex (USDT): Decreased 📉
✅ Summary: Bitfinex USDT was the only tracked spot pair to record a decline in whale CVD. The other three remained at yesterday's levels.
[10-26-2026]
foredex.io/charts/spot/cvd?r…


@ForeDex_Global Recognized Analyst @MurphyBTC puts #Bitcoin’s mixed signals in context using ForeDex API:
🐱 Macro conditions remain under pressure despite U.S. M2 growth of 5.7% YoY. Oil above $100, CPI at 3.7%, a 4.00% Fed Funds Rate, and softer employment data weigh on risk assets. Stablecoin supply is broadly flat, while DeFi TVL has fallen 5.5% over 30 days.
➡️ #Bitcoin’s longer-term valuation remains constructive, with MVRV Z-Score at 0.92, Realized Price near $53.5K, and Reserve Risk at 0.0006. Strategy added 8,070 $BTC over 60 days, while ETF inflows continue to provide institutional demand.
➡️ However, LTH supply declined roughly 133K $BTC in 30 days, exchange inflows have increased, whale flows indicate distribution, and miner selling remains elevated. The key is whether continued ETF and corporate buying can absorb this supply as LTH distribution stabilizes. ✅
foredex.io/charts/macro?ref=…


暗号資産マーケット情報局 #BTC
______________
📊マクロ分析 @ForeDex_Global API データ使用
評価:中立
米M2 YoY +5.7%(流動性拡大)
イールドカーブ +0.32%pt(10年-2年、正常範囲)
FRB総資産 $6,754B (30日 +7.1B) ほぼ横ばい
原油WTI $100.76 (30日 +6.5%) 上昇
USDJPY ¥157.0(30日 -0.8%、安定圏)
FF金利 4.00% (90日 +0.25%pt) 利上げ継続
CPI YoY +3.7% インフレ高止まり
NFP変化 +29K 労働市場弱含み
Gold $4,029 (30日 -6.2%) 下落
金/銀比率 74.7(70-80、中立)
Copper $6.44 (30日 -4.1%) 下落
ステーブルコイン総量 $303B(30日 -0.6%、横ばい)
DeFi TVL $90B(30日 -5.5%)
IV期間構造 通常コンタンゴ(-7.9pp、平穏)
(1) マクロムード:
地政学・原油高・インフレ懸念でリスクオフ優勢。テック株安・BTC急落(〜8.1万ドル)が続き、流動性期待は後退。
(2) 原油/地政学影響:
イラン・ホルムズ・フーシ攻撃で供給不安継続、Brent/WTIが114ドル超・5カ月高値。インフレ再燃でグローバル成長を圧迫。
(3) FRB政策方向:
3.75-4.00%据え置き基調(10月はほぼ確実)、年末追加利上げ確率は揺れるも「higher for longer」。原油由来の粘着インフレで2026年大幅緩和は後退。
(4) 総合判定:
2026年クリプトは地政学・原油主導のインフレ+タカ派FRBでリスクオフ継続。停戦・原油急落が転換材料。
✅ 重要ポイントまとめ
現在のマクロ環境は、原油高によるインフレ圧力と、高金利による景気下押しが併存する局面です。
物価が下がりにくいためFRBは金融緩和に動きづらく、家計や企業への負担が続いています。雇用の伸びは弱いものの失業率は安定しており、景気後退が確定した状況ではありません。
今後の焦点は、中東の供給不安が和らいで原油価格が落ち着き、景気を大きく傷めずにインフレを抑えられるかです。
_______________
📊BTC中長期分析 【ForeDex データ使用】
ETF機関保有 $3.1B(605機関・参考水準/非加点)
MSTR 60日で +8,070 BTC 大幅買い増し
MSTR平均取得コスト $75,446
マイニング総コスト $77,476(フロアの目安)
次回半減期まで542日(サイクル最強帯)
MVRV Z-Score 0.92 中立帯(健全な強気〜やや強気)
Realized Price $53,501(現在比 +52%、健全な強気)
Hash Rate -7.2% (30日) マイナー減少基調
MSTR株価 -10.1% (30日) 機関基調弱気
Reserve Risk 0.0006 歴史的蓄積機会
市場時価/Thermo Cap 17.0x やや過熱
含み損益ストレス+ETF分離MVRV 過熱寄り
取引所の在庫とフロー 取引所へ流入(供給増)
取引所クジラ資金フロー指標 分配(2026-10-19・4日前)
マイニング会社セルサイドフロー マイナーの売却が多い
(1) 機関投資家・LTHセンチメント:
強気・高確信。BlackRock等ETF投資家は「長期バイ&ホールド」でベア中も90%が着実蓄積、LTHも弱気相場で供給ATH更新し忍耐強い。
(2) 蓄積or分配:
蓄積優勢。2026年LTH供給が大幅増(例: 年初来+270万BTC超、過去サイクル比4倍超吸収)、機関(Strategy/MSTR・IBIT等)も企業・ETF経由で継続買い増し中。
(3) 評決:
長期強気。弱気手から強気手への移転が進み、供給逼迫で次サイクル上昇基盤形成中。
✅ 重要ポイントまとめ
BTCは、企業・ETFの買い需要と、長期保有者の分配が混在する局面です。
Strategyの保有量は直近約2カ月で8,070 BTC増加し、米現物ETFも10月19〜22日合計で約4.39億ドルの純流入。継続的な買い需要は残っています。
一方、LTHの保有供給は30日で約13.3万BTC減少し、純分配を示しています。ただし、この減少量がそのまま市場での売却量を意味するわけではありません。
現状では「蓄積優勢による供給逼迫」とも「市場全体で売り優勢」とも断定できません。今後は、LTHの分配が落ち着くか、ETFなどへの資金流入が続き、出てくる供給を吸収できるかが焦点です。
_______________
📊本日の総合分析
①短期トレンド (価格 vs MA) 弱気
現在価格 81,416米ドル は 7日MA (82,243) と 30日MA (83,457) の両方を下回り、短期は下降トレンドです。
②累積CVD(買い圧 − 売り圧) 弱気
直近30日で累積CVDが-912,539,794(売り優勢)。現物市場で売り手が押し下げ気味で、上値が重い局面です。
③マーケットメイカー純フロー 弱気
直近30日のMM純フローは+15,062 BTC(取引所への流入優勢)。MMが在庫を取引所に戻しており、売却準備の可能性。
④価格 vs CVD ダイバージェンス 中立
直近30日間にダイバージェンスは検出されませんでした。
⑤トップトレーダーのネットポジション 弱気
Hyperliquid上位10名の全建玉は ロング $93.9M / ショート $1824.8M、ネット -90%ショート優勢。プロがアルトを含め資金を投じて下落に賭けている状況。(参考:BTC単独は ロング $0.0M / ショート $467.5M、ネット -100%)
⑥Funding Rate判定(FR・乖離) やや弱気
3取引所のFR平均と乖離を逆張り判定。スコア -0.5:FR平均 +0.0058% 中立(±0) / HL ロング寄り乖離→やや弱気(-0.5)。
⑦リアルタイム短期センチメント 弱気
Coinbaseプレミアム -0.129% → 米国が売り優勢 🔴 / キムチプレミアム +0.84% → 正常レンジ ⚪ / Fear&Greed 50 → Greed。
⑧BTC スポットETF 日別フロー(Farside)中立
直近5営業日累計 $+357M。最新日(22 Oct 2026)$-635.6M。流出入が拮抗、ETFからの方向感は弱い。
⑨BTCオプション市場シグナル(Deribit)弱気
PCR 0.59 → コール過熱 🔴 天井警戒 / Max Pain $80,000(-3.1%)→ 下への引力あり 🔴 / IV水準 29.1% → 低ボラ 静寂期 / 25Δ RR +2.3% → 中立 ⚪。
⑩OI判定(短期OI動学・価格×建玉) 中立
24h 価格 -0.7% × 建玉(BTC建て) +1.7%。価格が小動きで、建玉増減から明確な方向は読めません。
🐋 サイズ別フロー観測
機関カストディ:純-139 BTC(取引所へ流入=供給増(弱気寄り)・主導 100-500帯)
マーケットメーカー:純+1,273 BTC(取引所から引出=供給減(強気寄り)・主導 10-100帯)
1K+の大口移動なし
総合判定:待つ/戻り売り
推奨アクション:新規買いは控える。戻りで一部売却を検討
_______________
🌊 アルトコイン資金フローのフェーズ判定
フェーズ 1:BTC支配
主要アルトの対BTC平均相関0.919
30日方向→ 横ばい
(+0.005)
📌 推奨アクション
BTC支配が安定。メジャー保有を継続しつつ、注目アルトの監視リスト作成を始める段階。
注目銘柄:なし

@ForeDex_Global Recognized Analyst @gaah_im examines the level where #Bitcoin meets its first support test:
🏋️ #Bitcoin’s 'Short-Term Holder Realized Price' has risen roughly 6% since the breakout two months ago and now stands near $75K, making it a key short-term support level. This area is expected to serve as an initial floor if $BTC pulls back.
📈 Throughout the bear market, 'STH Realized Price' acted as resistance. Reclaiming this level and confirming it as support would signal a shift in market structure and strengthen the case for a trend reversal.
foredex.io/charts/on-chain/b…


STH Realized Price has risen by about +6% since #Bitcoin breakout two months ago.
Currently sitting at ~$75k, this is the main short-term technical support level for #BTC — the expectation is that this region will initially be tested as a floor.
Throughout the bear market, STH realized price acted as resistance — once broken and confirmed as support, this signals trend reversal.
@ForeDex_Global

Daily ForeDex CVD by Order Size (Spot) Snapshot 📸
🔸 Whales and Mega Whales Only
🔸 Based on a 1 month period (1M)
1. Binance: Increased 📈
2. Bybit: No Change ➖
3. Bitfinex (USD): No Change ➖
4. Bitfinex (USDT): No Change ➖
✅ Summary: Binance whale CVD increased from yesterday, while Bybit and both Bitfinex pairs showed no change.
[10-25-2026]
foredex.io/charts/spot/cvd?r…


🗳️ Day 6 of Voting — Your Daily Vote Is Calling! 📣
🚀 ForeDex founder @mignoletkr has been nominated for the 2026 BINANCE THE BLOCKCHAIN 100 in the Content Creator – Best Longform Creator category!
We're cheering him on and hoping he makes it into the final Blockchain 100! 🎉
✅ The competition is still going strong, and every vote counts!
🗳️ It's Day 6 of voting! Yesterday's vote was appreciated, but today's vote is just as important! 😄
You can vote for @mignoletkr once every day, so let's keep those votes coming! 🙏
Six days in, and we're still aiming for the final 100!
Thanks for sticking with us and showing your support! ❤️
👉binance.com/en/square/blockc…

🌪️ The market may face new turbulence, but the long-term picture tells a more confident story. @ForeDex_Global Recognized Analyst @AltcoinLtd takes a closer look:
💎 #Bitcoin’s June 2026 low remains the likely cycle bottom. The 'LTH Supply in Loss %' has declined sharply since June, reinforcing the view that #Bitcoin has already passed its major bottom.
💎 Geopolitical risks may continue to bring volatility to the crypto market, but a decline below the June low is considered unlikely. The broader outlook remains bullish, with a continued long bias. 🚀
foredex.io/charts/on-chain/b…


$BTC
제 관점은 변화가 없으며 2026년 6월에 비트코인은 바닥을 찍었다고 봅니다.
Supply In Loss % - LTH 차트를 보면서 다시 확신하고 확인 가능하며 그 이후 손실 중인 공급량 비율이 급격히 꺾이는 추세로 돌입하였습니다.
꾸준히 관점을 유지해왔듯이, 지정학적 문제등으로 암호화폐 시장에 변동성이 계속 있을수있으나 6월 바닥 그 아래로 떨어지는 시나리오는 현저히 낮다고 판단되며,
제 관점은 계속해서 "롱"입니다.
@ForeDex_Global

@ForeDex_Global Recognized Analyst @Satoureireal tracks #Bitcoin’s changing relationship with the 200WMA:
📈 $BTC repeatedly dipped below the '200 Week Moving Average' from June to August before sharply reclaiming it in a single move in mid August. Since then, $BTC has remained above the indicator through September and October, even as price pulled back from recent highs. 🔍
📉 The rising '200WMA' and sustained price gap support a constructive long-term structure. However, if that gap continues to narrow, another retest becomes possible, while a sustained break below the '200WMA' would flip the bullish picture. 🤯
foredex.io/charts/cycle/200-…


The real $BTC signal right now: the gap between price and the 200-week moving average.
- Jun-Aug: repeated dips below the 200WMA.
- Mid-Aug: a sharp reclaim in a single move.
- Sep-Oct: the gap has held, even as price cooled off its latest highs.
A rising 200WMA with price well above it is a constructive long-term setup. If the gap keeps shrinking, another retest is possible. A sustained drop back below would flip the picture.
Data: @ForeDex_Global

🗣️ A rally without the familiar bullish chorus. @ForeDex_Global Recognized Analyst @PravattaMarcelo takes a closer look at the creator sentiment:
📺 Despite #Bitcoin’s recovery in recent months, the 'Crypto YouTube Narrative Index' remains near 51, within neutral territory. This is well below the elevated readings seen throughout much of 2025, when crypto narratives frequently reached bullish and extreme bullish levels.
📺 $BTC price has recovered, but YouTube sentiment has yet to follow. Whether bullish narratives catch up with the price recovery remains the key signal to watch.🤫
foredex.io/charts/sentiment/…


Despite Bitcoin’s rally in recent months, the Crypto YouTube Narrative Index remains subdued at 51, still in neutral territory.
That’s well below the elevated readings seen through much of 2025, when crypto narratives repeatedly reached bullish and extreme-bullish levels.
Price has recovered, but the YouTube narrative has yet to return to those levels. I’ll be watching to see whether sentiment catches up.
Data & chart: @ForeDex_Global

@ForeDex_Global Recognized Analyst @KaanChart maps the liquidity levels shaping #Bitcoin’s next move:
🔎 $BTC is trading near $81.2K after breaking its ascending hourly structure. The 'Futures Taker Buy/Sell Ratio' stands at -0.08, favouring aggressive selling, while the 'Funding Rate' remains positive near +0.005. Selling pressure is present, but funding has not turned clearly negative.🧐
🔎 Continued trading below $82.1K~$82.4K keeps the lower liquidity zone at $80.8K~$80.5K in focus. Reclaiming and holding above $82.4K would weaken the bearish setup and open a potential recovery toward higher resistance levels.
✅ The broader liquidity structure has yet to confirm renewed accumulation. Futures order flow supports the current weakness, while the next directional move depends on how price responds at these liquidity levels.
foredex.io/charts/derivative…


bitcoin:native | هل بدأ ضغط البيع يكشف الهدف التالي؟
البيتكوين قرب 81.2K بعد كسر الهيكل الصاعد على الساعة، لكن بيانات @ForeDex_Global تكشف تفصيلًا أهم من الهبوط نفسه.
مؤشر Futures Taker Buy/Sell
عند -0.08 يشير إلى أفضلية البيع العدواني، بينما Funding Rate ما زال موجبًا قرب +0.005.
بمعنى أن ضغط البيع حاضر، لكن التمويل لم يتحول بعد إلى سلبية واضحة.
📉 استمرار التداول تحت 82.1K–82.4K يبقي سيناريو اختبار السيولة السفلية عند 80.8K–80.5K قائمًا.
📈 استعادة 82.4K والثبات فوقها تضعف السيناريو الهبوطي وتفتح فرصة لاختبار المقاومات الأعلى.
وفي الخلفية، لم نرى من نظام سيولة السوق تأكيد تجميع جديدًا.
السعر يكشف ضعف الهيكل، وتدفقات العقود تؤيده، لكن تأكيد الحركة التالية يبقى عند مستويات السيولة.
Data via @ForeDex_Proof 📊
#BTC #Bitcoin


Daily ForeDex CVD by Order Size (Spot) Snapshot 📸
🔸 Whales and Mega Whales Only
🔸 Based on a 1 month period (1M)
1. Binance: Increased 📈
2. Bybit: Increased 📈
3. Bitfinex (USD): No Change ➖
4. Bitfinex (USDT): No Change ➖
✅ Summary: Binance whale CVD increased from yesterday, although some of the intraday gain was reversed. Bybit also increased, while both Bitfinex pairs showed no change.
[10-24-2026]
foredex.io/charts/spot/cvd?r…


🗳 Day 5 of Voting - Yes, You Can Vote Again! 🙏
🚀 ForeDex founder @mignoletkr has been nominated for the 2026 BINANCE THE BLOCKCHAIN 100 in the Content Creator – Best Longform Creator category!
We're cheering him on and hoping he makes it into the final Blockchain 100! 🎉
✅ The competition is heating up, and every vote counts!
🗳 It's Day 5 of voting! Voted yesterday? Great! You can vote for @mignoletkr again today. And tomorrow, too! 😄
Let's help our founder make it into the final 100!
Thanks for keeping the votes coming! 🙏❤️
👉 binance.com/en/square/blockc…

🐰 @ForeDex_Global Recognized Analyst @Projectrin_k tracks #Bitcoin demand across spot and futures:
🎢 Following $BTC’s sharp decline, Binance Spot CVD shows renewed buying across Small, Medium, and Whale order sizes, while the Large category remains dominated by selling. Spot demand is recovering, but participation remains uneven.
📈 In futures, Binance’s top traders hold 60.44% long positions versus 39.56% short, with long exposure roughly 1.53 times greater. Buying is therefore dominant across both spot and futures, although downside liquidation risk remains.
🐳 The key signals are whether Whale buying continues and Large order selling weakens. Stronger alignment across these groups could support a more substantial $BTC rebound.✅
foredex.io/charts/spot/cvd?r…


【相場分析]
✅現物需要
BTC急落後、現物には一部の買い戻が発生。
@ForeDex_Global のBinance現物CVDでは、前日の記録から
Small、Medium、Whale区分が買い優勢となっています。
一方、Large区分は売り優勢で、買い需要の回復にはばらつきあり。
比較:10月22日→23日途中。
✅先物需要
Binance上位トレーダーのBTCUSDTポジション量は、
🟢 ロング 60.44%
🔴 ショート 39.56%
ロングが約1.53倍です。
※10月23日14:20。
清算が下げを強める可能性がある事は注視しつつ、現状は急落から現物、先物共に買いが優勢です。
注目は、Whale区分の買い継続とLarge区分の売りの弱まり。
これが大きな反発の予兆となる可能性があります。
※CVDは注文サイズ別の分類。
👇ダッシュボード
btc-gold.jp/bitcoin-dashboar…
#ビットコイン #仮想通貨 #オンチェーンデータ


@ForeDex_Global Recognized Analyst @PelinayPA on the #Bitcoin options balance:
👩🏫 'Bitcoin Institutional ETF Options Exposure' has become more cautious. The Put/Call Ratio has risen to 0.94, with calls still slightly exceeding puts, indicating a nearly balanced market rather than a clear bearish shift.
🔸 The ratio rose as call exposure declined in Q2 2026, when $BTC traded weakly around $60K–$80K, and remained elevated during the recovery.
🔸 Greater put positioning reflects increased attention to downside protection, while market maker hedging may influence $BTC prices depending on options exposure.
✍️ With $BTC near $82K, the current structure shows growing institutional caution without confirming a bearish direction. Stronger confirmation would require continued changes in options positioning, supported by trading volume, open interest, and actual Spot ETF flows. ✅
foredex.io/charts/institutio…


Bitcoin Tarafında Kurumsallar Temkinli
Grafik, Put/call oranının 1’e yaklaşması, put göstergesinin call’a göre güçlendiğini; yani opsiyon pozisyonlarında aşağı yönlü korunmanın veya düşüş beklentisinin daha fazla yer tuttuğunu düşündürür. Ancak oran hâlâ 1’in altında ve grafikteki call seviyesi put seviyesinden az farkla yüksek. Bu yüzden görünüm hafif call ağırlıklı ama belirgin biçimde dengelenmiş olarak okunabilir.
Grafikteki belirgin değişim, 2026’nın ikinci çeyreğinde call göstergesinin gerilemesi ve put/call oranının yükselmesi. Aynı dönemde BTC yaklaşık 60–80 bin dolar bandında zayıf seyrediyor. Sonrasında fiyat toparlanırken oran yüksek kalıyor. Bu eşzamanlılık, opsiyon pozisyonlamasının fiyatla ilişkili olduğunu gösterir; tek başına opsiyon hareketinin fiyat düşüşüne veya toparlanmasına neden olduğunu kanıtlamaz.
ETF opsiyon hareketi BTC fiyatına nasıl yansıyabilir?
Aktarım genellikle opsiyonları alan ve satan piyasa yapıcıların hedge işlemleri üzerinden olur. Call talebi artarsa, opsiyon satıcıları risklerini dengelemek için ETF hissesi veya #BTC bağlantılı araçlar alabilir. Bu alımlar yükselişi destekleyebilir; fiyat yükseldikçe ek hedge alımı gerekmesi hareketi büyütebilir. Put talebi artarsa, bu hem yatırımcıların düşüşe karşı korunma aradığını gösterebilir hem de opsiyon satıcılarının hedge ihtiyacını artırabilir. Bu hedge’ler koşullara göre ETF satışı, kısa pozisyon veya başka türev işlemleri içerebilir; dolayısıyla fiyat üzerinde aşağı yönlü baskı oluşabilir.
Fakat etki pozisyonun kimde olduğuna, opsiyonların alınıp mı satıldığına, kullanım fiyatlarına, vadeye ve piyasa yapıcıların net gamma pozisyonuna bağlıdır. Call ve put miktarları tek başına hedge yönünü belirlemez. Örneğin call’ların önemli bölümü satılmış pozisyonlardan oluşuyorsa, fiyat yükselişinde hedge davranışı farklı olabilir.
Mevcut tabloda, güçlü bir yükseliş sinyalinden çok kurumsal opsiyon tarafında artan temkin ve daha dengeli yön beklentisi gösteriyor. Oranın 0,94’e yükselmesi aşağı yönlü korumanın önem kazandığına işaret edebilir; buna karşılık call göstergesinin hâlâ hafif yüksek olması pozisyonlamanın bütünüyle düşüş yönüne dönmediğini düşündürüyor.
BTC’nin yaklaşık 82 bin dolar civarında olması, grafikteki opsiyon ölçümlerinin fiyatı otomatik olarak belli bir yöne taşıdığı anlamına gelmez. Fiyat etkisinin güçlenmesi için put/call oranındaki artışın sürmesi, işlem hacmi ve açık pozisyonla doğrulanması ve ETF’lerdeki gerçek spot para giriş/çıkışlarıyla aynı yönde hareket etmesi gerekir.
@ForeDex_Global : foredex.io/charts/institutio…
⚠️ #tanıtım veya yatırım tavsiyesi değildir. Grafik ve yorum analiz amaçlıdır.

🛤️ Can Bitcoin follow its own path? @ForeDex_Global Recognized Analyst @zfcbtc examines the cycle question:
🌐 China’s A-shares, South Korea’s KOSPI, Japan’s Nikkei, and the U.S. semiconductor sector are all trending lower. Against this backdrop, #Bitcoin’s ability to sustain an independent rally becomes an important question.
🔎 Historically, #Bitcoin halvings have occurred around the middle of broader bull markets. Based on this pattern, $BTC could reach $120K–$140K by the 2028 halving, preceded by an early phase of volatile upward movement.
🚀 This supports the view that #Bitcoin may already be entering a new bull market, even as traditional equity markets weaken. The key question is whether $BTC can sustain that trend independently of broader market pressure.🧐
foredex.io/charts/cycle/bitc…


在全球 AI 基础设施股票崩溃的大背景之下:
中国的 A 股、韩国的 KOSPI、日本的日经指数、美国的 SOX(费城半导体指数)都在走熊的背景之下。
那么比特币能不能走出一个独立的行情?这应该是每一个参与者所关注的事情。
来自 @ForeDex_Global 比特币减半的这张数据图就很有意思。
历史上,比特币减半都是在牛市的半程之中。从这个图表大体上目测:
2028 年比特币减半的时候,价格应该在 12 万到 14 万左右。在此之前,应该属于牛市震荡上行的开始阶段。
那么这就很有趣了:你能不能认定当前处于比特币独特的牛市进程当中,而且你会一直参与,不会感到恐惧?你能做到吗?

🌈 The growth curve and its outer bands tell different stories. @ForeDex_Global Recognized Analyst @justindanethan examines the balance:
👨🏫 #Bitcoin’s 'Rainbow Chart' has limitations, particularly in its outer bands, which have struggled to capture changing volatility across cycles. Earlier cycles delivered greater upside, while recent bottoms have extended further below the model’s lower boundaries.
📈 Even so, its logarithmic structure remains useful for tracking #Bitcoin’s nonlinear long-term growth. The recent return to the purple zone is viewed as a sign that a market bottom may already be in place, with further upside now becoming more likely. 👀
✅ This reinforces confidence in $BTC accumulation around the $60K–$70K range, despite the chart’s imperfect historical boundaries.
foredex.io/charts/cycle/bitc…


There have been a lot of critics of the rainbow chart, and for good reasons.
It doesn't take a genius to see the volatility and so the outer bounds don't really track: the beginnings had more upside; the current bottoms are more downside.
But still, the exponential nature of new technologies hints at a non-linear growth, on a logarithmic chart, and that's what this shows.
I still feel like re-entering in the purple layer hints at a bottom having been marked, and the upside is now in play, whehter we need to head back to or out of the red zone or not.
Not financial advice but I'm feeling more and more confident about my accumulation in the 60K and 70K zones.
Thanks to @ForeDex_Global for providing the chart 🤗
#crypto #defi #trading

Daily ForeDex CVD by Order Size (Spot) Snapshot 📸
🔸 Whales and Mega Whales Only
🔸 Based on a 1 month period (1M)
1. Binance: Decreased 📉
2. Bybit: Decreased 📉
3. Bitfinex (USD): No Change ➖
4. Bitfinex (USDT): Increased 📈
✅ Summary: Binance and Bybit whale CVD decreased from yesterday, while Bitfinex USDT increased. Bitfinex USD showed no change.
[10-23-2026]
foredex.io/charts/spot/cvd?r…


🗳️ Day 4 of Voting — Another Day, Another Vote! 🙏
🚀 ForeDex founder @mignoletkr has been nominated for the 2026 BINANCE THE BLOCKCHAIN 100 in the Content Creator – Best Longform Creator category!
We're cheering him on and hoping he makes it into the final Blockchain 100! 🎉
✅ The competition is getting intense, and every vote counts!
🗳️ It's Day 4 of voting! Remember, you can vote for @mignoletkr once every day, so please keep showing your support! 🙏
Let's help our founder make it into the final 100!
Thanks for your continued support! 😘
binance.com/en/square/blockc…

🧸 @ForeDex_Global Recognized Analyst @0xGummyBear traces the support zones behind the current cycle view:
🟣 #Bitcoin’s '200-Week Moving Average (200WMA)' has historically marked major cycle transitions. Falling below it often coincided with bear market bottoming phases, while reclaiming it generally signalled the beginning of a new bull market.
🟣 The 2022 bottoming process was unusually prolonged, with $BTC slipping below the 200WMA again in 2023. However, the $24K–$25K support zone established after the initial breakout held during subsequent pullbacks.🔍
✅ In the current cycle, $BTC has reclaimed the 200WMA, while recent corrections have held the $74K–$78K support zone. As long as this support remains intact, the broader bullish trend is expected to continue.📈
foredex.io/charts/cycle/200-…


今天来看看第二个宏观周期指标,也就是常被大家讨论的“200WMA指标”。
与昨天提到的Golden Ratio Multiplier(使用350DMA作为基准)不同,它的基准线是使用“200周移动平均线”。
从过往规律可以看到:
🟣每次价格跌破200WMA,几乎都代表进入了该轮熊市的底部周期。
🟣当价格再次上穿200WMA后,通常就是下一轮牛市的起点了。
不过也要特别留意,2022年的底部周期相较前几次拉得特别长。
而且价格在2022年3月上穿指标后,在2023年6月与9月都曾再次跌到指标以下。
但如果我们细拆数据来看,这两次的回踩价格,其实都稳稳守在第一次突破时的24K~25K支撑区以上。
套用到这一轮周期,可以看到价格目前已经重新站稳在200WMA之上了。
而且最近的几次回调,也都没有跌破第一次突破后形成的74K~78K支撑区。
所以我们可以大胆假设:
只要未来出现的回调没有“有效跌破”74K~78K,那么这一轮牛市的趋势就依然存在。
接下来大家要做的很简单,就是坐稳等风来啰!
数据来源:@ForeDex_Global

@ForeDex_Global Recognized Analyst @RugaResearch examines the pattern behind #Bitcoin’s positive ETF sessions:
📊 'Bitcoin Spot ETF Netflow Total' recorded $526.7M in net inflows on October 19, $23.2M on October 20, and $524.8M on October 21, while $BTC rose from $82.4K to $83.7K. Despite three consecutive positive sessions, nearly all inflows came from two large spikes, with minimal buying between them.
✅ The next test is whether ETF inflows continue beyond these spikes while $BTC holds its gains. If flows fade and price stalls, the recent buying will have lacked the follow-through needed to establish a stronger trend.
foredex.io/charts/etf/spot-e…


📊 $BTC spot ETF flows printed +526.7M on Oct 19, +23.2M on Oct 20, and +524.8M on Oct 21.
Three positive sessions, but almost all the flow came in two bursts. The BTC-price overlay moved from $82.4K to $83.7K across those dates.
That middle day is what caught my eye. Buyers showed up through ETFs, but Tuesday was barely positive between two strong prints. I’m not calling this a persistent ETF bid from three sessions alone.
The next test is whether inflows keep arriving after the spikes and BTC holds the move. If flows fade while price stalls, the burst was real, but follow-through is still missing. 👀
Chart: @ForeDex_Global
