

Interests: Data. Python. Economics. Social Policy. Politics. Australia. Caveats: Not financial advice. Opinions my own. Likes ≠ endorsement.
Canberra, Australia
Joined March 2012
- Tweets9.9K
- Following2.7K
- Followers5.9K
- Likes5K
Using less oil per dollar of output means a price shock costs the economy less than in the 1970s. But Australia is more exposed than in the 1970s to the physical supply of oil being cut off.
In the 1970s Bass Strait supplied most of Australia's crude. Today about 90% of liquid fuels are imported, and only two refineries are left (Geelong and Lytton).


Why does the RBA watch the trimmed mean?
The RBA targets headline CPI inflation. But headline inflation is noisy. One-off price shocks push it around: the GST in 2000, free childcare and the fuel price collapse in 2020. A central bank can’t set policy on that noise. It needs a measure of the underlying trend. This is sometimes called core inflation.
The ABS publishes two. The trimmed mean drops the 15% of price changes at each end of the distribution and averages the middle 70%. The weighted median takes the single price change in the middle.
A good underlying measure has to pass three tests.
First, it must not drift from headline over time. If the target is headline, the trend measure has to track it in the long run. Since 1987, the quarterly gap between the trimmed mean and headline averages 0.00 points. The weighted median averages 0.01. Both look unbiased in growth terms.
Second, it must be less volatile than headline. Both underlying measures cut the volatility of quarterly inflation by about two thirds.
Third, it must be persistent. This quarter’s reading should tell you something about next quarter’s. Headline inflation has an autocorrelation of about 0.4. Both underlying measures sit near 0.85.
So why the trimmed mean over the weighted median? On noise and persistence, the median currently wins by a whisker. But the price level chart [see follow-on tweet] shows where the median falls down. It wanders much further from headline. After nearly forty years, the trimmed mean index sits about 1% above headline. The weighted median sits about 1.5% above, and it ran as far as 6% above in 2020. Small biases in quarterly growth compound into large gaps in the price level. For a bank that targets headline, that matters.
The reason lies in how each measure is built. The median rests on one item: whichever price change happens to land in the middle. When the distribution of price changes is lumpy, the middle can jump from one item to another, and the median lurches with it. The trimmed mean uses 70% of the basket. It throws away the outliers but keeps most of the information. That makes it harder to knock off course.
The trimmed mean also has a simpler story. It’s an average with the extremes removed. Anyone can understand that.
So the RBA takes the measure that filters the noise without losing touch with the thing it’s trying to control.
1/2 ...


I often see people who argue that Austrlia is in stagflation. Yes there are issues at the moment. But they are nothing like the 1970s to 80s Stagflation period.

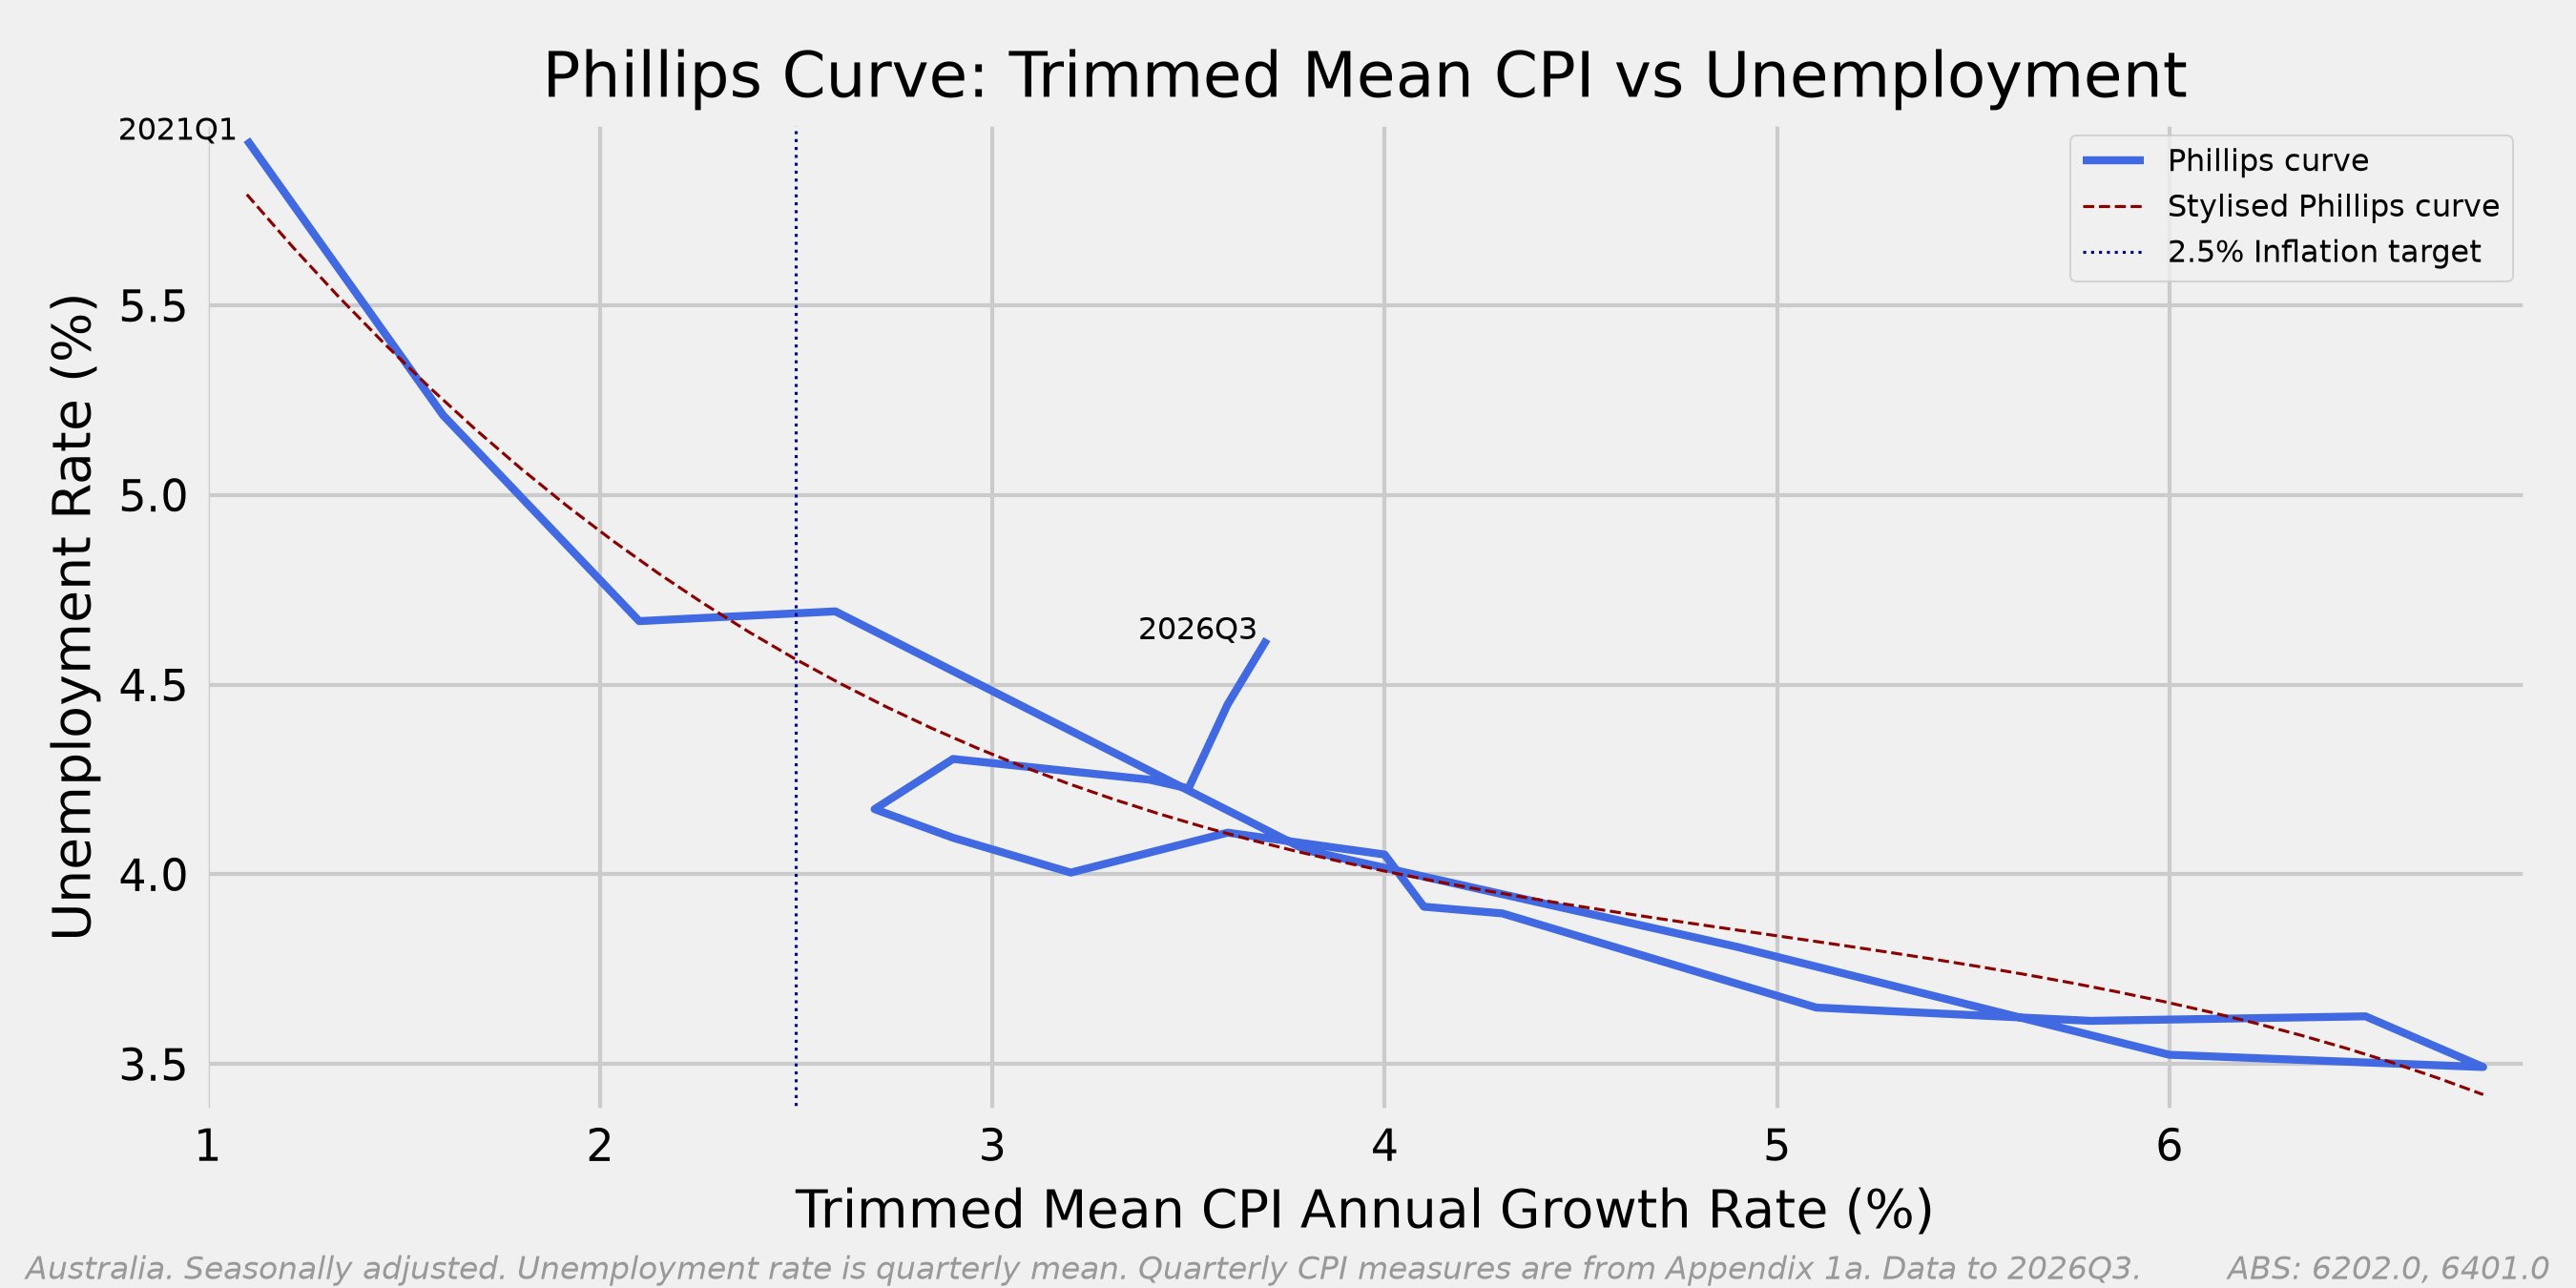


Why is inflation sticky and domestically driven? With zero productivity growth since 2019, wages can only rise about 2.5% a year without pushing up costs. Private wages are rising 3.1%.
That gap (about half a point) has been there since 2022. It has narrowed from about 1.5 points in late 2023, but not closed. Wages are rising faster than 2.5% inflation plus what productivity can absorb.
It's the same with public sector pay included (3.2%), but private wages are the better signal: they track the labour market far more closely than public pay.
The fix isn't necessarily slower wages growth. A return to even 1% productivity growth would lift the benchmark to 3.5%, and today's wage growth would sit below it.
[Note: corrects an earlier tweet from me, since deleted].


