

Interests: Data. Python. Economics. Social Policy. Politics. Australia. Caveats: Not financial advice. Opinions my own. Likes ≠ endorsement.
Canberra, Australia
Joined March 2012
- Tweets9.9K
- Following2.7K
- Followers5.9K
- Likes5K




Mark 🇦🇺 retweeted
Why does the RBA watch the trimmed mean?
The RBA targets headline CPI inflation. But headline inflation is noisy. One-off price shocks push it around: the GST in 2000, free childcare and the fuel price collapse in 2020. A central bank can’t set policy on that noise. It needs a measure of the underlying trend. This is sometimes called core inflation.
The ABS publishes two. The trimmed mean drops the 15% of price changes at each end of the distribution and averages the middle 70%. The weighted median takes the single price change in the middle.
A good underlying measure has to pass three tests.
First, it must not drift from headline over time. If the target is headline, the trend measure has to track it in the long run. Since 1987, the quarterly gap between the trimmed mean and headline averages 0.00 points. The weighted median averages 0.01. Both look unbiased in growth terms.
Second, it must be less volatile than headline. Both underlying measures cut the volatility of quarterly inflation by about two thirds.
Third, it must be persistent. This quarter’s reading should tell you something about next quarter’s. Headline inflation has an autocorrelation of about 0.4. Both underlying measures sit near 0.85.
So why the trimmed mean over the weighted median? On noise and persistence, the median currently wins by a whisker. But the price level chart [see follow-on tweet] shows where the median falls down. It wanders much further from headline. After nearly forty years, the trimmed mean index sits about 1% above headline. The weighted median sits about 1.5% above, and it ran as far as 6% above in 2020. Small biases in quarterly growth compound into large gaps in the price level. For a bank that targets headline, that matters.
The reason lies in how each measure is built. The median rests on one item: whichever price change happens to land in the middle. When the distribution of price changes is lumpy, the middle can jump from one item to another, and the median lurches with it. The trimmed mean uses 70% of the basket. It throws away the outliers but keeps most of the information. That makes it harder to knock off course.
The trimmed mean also has a simpler story. It’s an average with the extremes removed. Anyone can understand that.
So the RBA takes the measure that filters the noise without losing touch with the thing it’s trying to control.
1/2 ...


Mark 🇦🇺 retweeted

It’s not often you get the opportunity to follow a former Treasurer on stage and pull apart the case they’ve just made. Wayne Swan told the The @FinancialReview Super & Wealth Summit that the CGT changes are 25 years overdue.
I then joined Rebecca Zwier, John Bongiorno and Michael Fox to explain why we think they’ll have disastrous consequences for the economy. From individual shareholders and business owners to companies raising capital and the property market. I learned from Michael that even the local art market is feeling the pain...
Investors are being pushed out of direct shares and into ETFs and other pooled structures to avoid tax rates as high as 82%. Meanwhile the ASX small cap market is a basket case - these changes will make it even harder for Australian businesses to attract capital and grow.
All four panellists agreed on one thing... hiking CGT isn’t the solution to Australia’s housing and productivity problems.
Thanks to @JoannaMather for leading a great discussion.
🤖 Made with AI


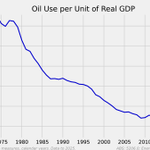
I often see people who argue that Austrlia is in stagflation. Yes there are issues at the moment. But they are nothing like the 1970s to 80s Stagflation period.



Mark 🇦🇺 retweeted
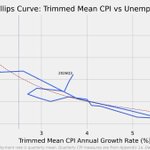
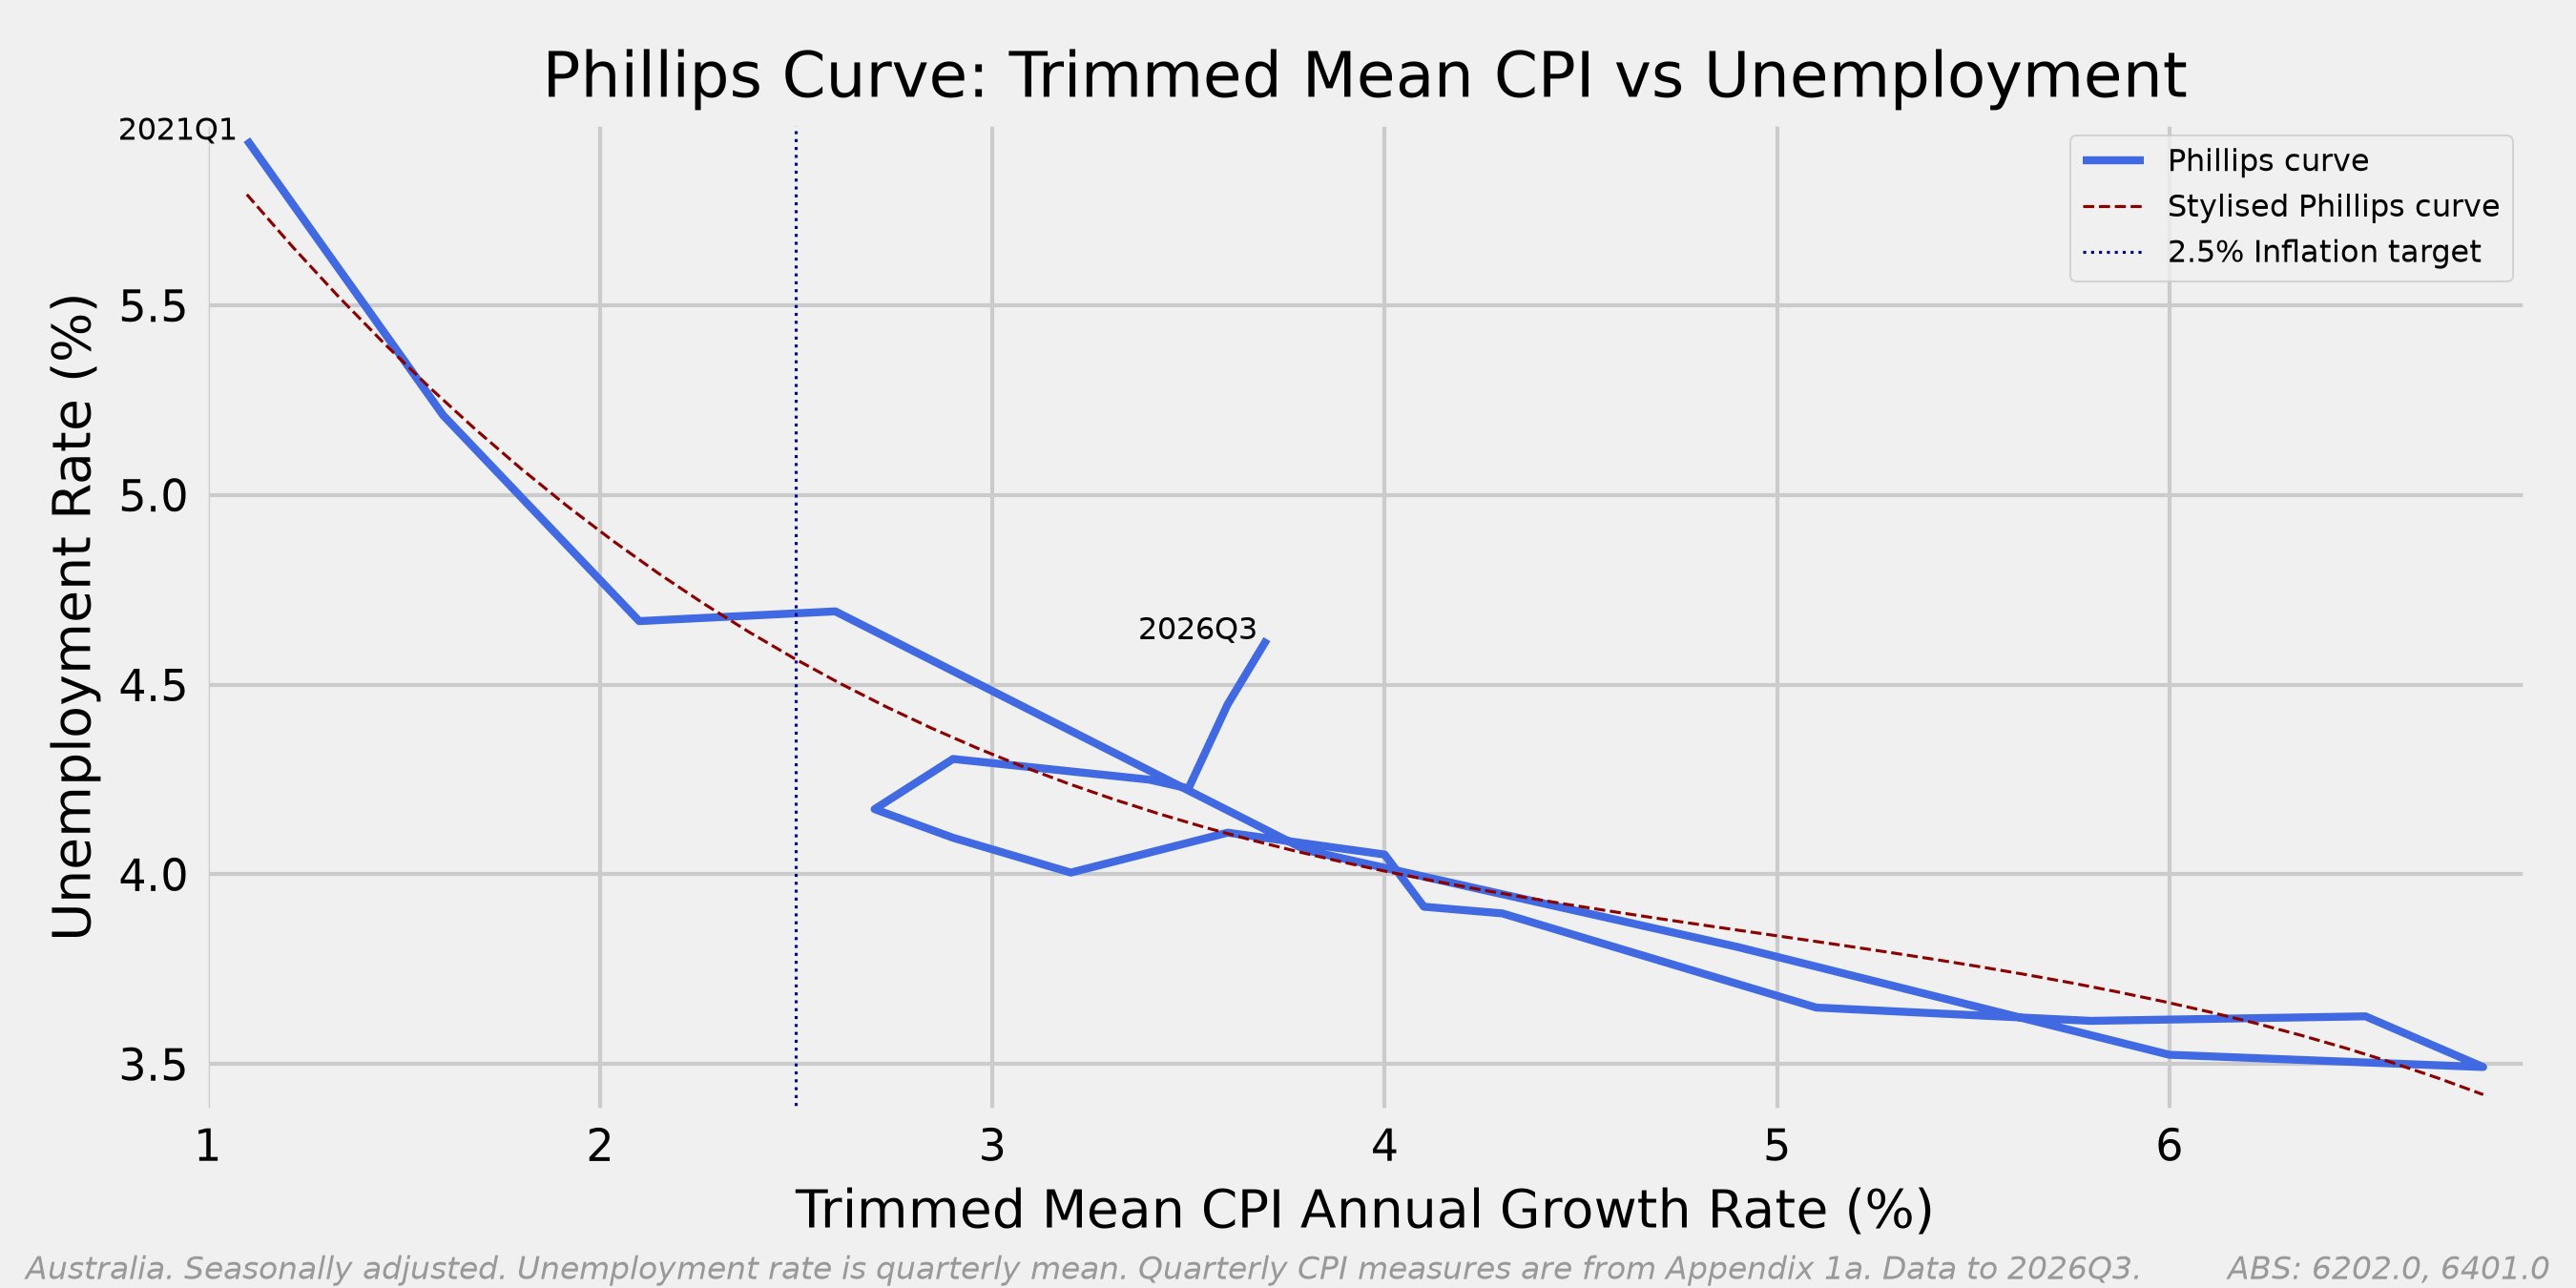
There are some signs of slowing in new dwelling price rises (its getting harder for builders to raise prices), but there are still more CPI items with inflation above 3%yoy and the trimmed mean inflation rate (which strips out big rises like petrol) seems stuck well above target.


Mark 🇦🇺 retweeted

CPI rose 4.3% in the year to September 2026
Find out more abs.gov.au/media-centre/medi…

Mark 🇦🇺 retweeted

We actually covered the S-1 filing announcement and what's in the filing here: teapawt.org/AGTPinsights/status/21…

Anthropic just made its S-1 public today. Here's what you need to know.
The filing went to the SEC on Oct 26 and Anthropic announced it on X. It plans to list on the Nasdaq Global Select Market under the ticker ANT. Goldman Sachs, Morgan Stanley and J.P. Morgan lead the deal. The price range and share count are not disclosed yet. The registration statement has not become effective, so no shares can be sold yet.
The financials are now public. H1 2026 revenue was $16.3B, up from about $1.1B a year ago. The net loss was $80.7B, but most of that came from accounting charges. The filing also shows a $974M operating profit and $131.7B in cash.
The compute bill is huge. Anthropic agreed to spend up to $120.5B with SpaceX's AI unit for access to Nvidia chips. Once all capacity is delivered, expected in December 2026, it pays about $3.1B a month. The deals run into 2029.
The filing also covers customers and control. Roughly one-fifth of revenue came from two customers. Founders keep 50.1% of the voting power through a founders' company. About 80 of the 261 pages are risk factors, including a warning that AI could pose catastrophic or existential risks to humanity.
Key numbers:
- ~250 customers pay over $10M a year
- 1,900 customers pay over $1M a year
- 11,900 customers pay over $100K a year
- $6.6M revenue per employee, per one investor's read
- $2.08 of revenue per $1 of compute, up from $0.40 in Q1 2025
Reports point to a listing in mid-November, with a possible valuation near $2T.

Mark 🇦🇺 retweeted

Q3 trimmed mean CPI
Last: 0.8pc
Mkt f/c: 1pc
Range: 0.9pc to 1pc
Core inflation expected to hold at around 3.6pc in the 12 months to September
Q4 headline inflation could well be lofty again with fuel costs leading the way; disinflationary pulse forecast to kick in only in CY2027
RBA has hiked 4 times already this year, but has openly flagged a further hike as likely…the path of least regret
Mark 🇦🇺 retweeted

The endless cost of living discussion is always selective and mostly focussed on elect/gas/petrol. Rarely discussed is how cheap some categories are eg kids tshirt $2.25!

Why is inflation sticky and domestically driven? With zero productivity growth since 2019, wages can only rise about 2.5% a year without pushing up costs. Private wages are rising 3.1%.
That gap (about half a point) has been there since 2022. It has narrowed from about 1.5 points in late 2023, but not closed. Wages are rising faster than 2.5% inflation plus what productivity can absorb.
It's the same with public sector pay included (3.2%), but private wages are the better signal: they track the labour market far more closely than public pay.
The fix isn't necessarily slower wages growth. A return to even 1% productivity growth would lift the benchmark to 3.5%, and today's wage growth would sit below it.
[Note: corrects an earlier tweet from me, since deleted].


Mark 🇦🇺 retweeted
There are obviously people struggling in Australia financially but 1/3 households struggling to put food on the table as these articles suggest is nonsense.

'Lucky country has become the hungry country': Foodbank Australia ift.tt/9HMYg18

Mark 🇦🇺 retweeted

It’s just very disappointing the RBA didn’t have the gumption to seriously tackle inflation in 2022 and 2023, sure the Middle Easy would be causing issues now but domestic inflationary pressures (of which there are still many) would have largely been contained.

Mark 🇦🇺 retweeted

This is a terrific and terrifying read from @insteconomics
Australia truly is the anti-Abundance nation
It's self-inflicted damage
We keep shooting ourselves in the foot and then wondering why we can't sprint anymore

Planning regulations add $42,000 in compliance costs to an attic renovation -- for no discernible benefit (other than as a make-work scheme for consultants).
stephenkirchner.substack.com…