

Investor, swing trader, and deep research. My opinion, not financial advice.
Romania
Joined June 2026
- Tweets15.1K
- Following1.2K
- Followers2.1K
- Likes41.4K



Pinned Tweet
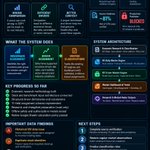
Market Strength Radar V4 Update. The system is growing, but now comes the part that matters most. Proving that it actually works better.
I haven't shared much about the development of V4 lately, but behind the scenes, I have continued working on what is becoming a much more comprehensive market research system.
And I want to share where the project stands, what has been accomplished, what is still missing and what I am trying to achieve.
First, an important distinction. V3 remains my active production system. V4 is still in development and validation.
I am not replacing a functioning system simply because I have built something more complicated.
V4 has to prove that its additional information actually improves how I identify market leadership and potential trading opportunities.
So what has changed?
The original Market Strength Radar was designed to identify stocks, sectors and themes showing relative strength. It helped me understand where leadership was concentrated and where new opportunities might be developing.
V4 takes that idea much further.
Instead of only asking which stocks are strong today, I want to understand how that strength developed, whether it is accelerating or weakening, how broadly it is spreading and what tends to happen afterward.
The new research architecture now includes improved price adjustment analysis, shorter term relative strength, momentum velocity and acceleration, stock rankings relative to their peers, volume behavior and volatility conditions.
It also examines whether leadership is spreading across more companies within a sector or becoming increasingly concentrated in a few names.
Another important addition is the relationship between relative strength and actual chart structure.
A stock can have excellent relative strength while being badly extended above support or sitting directly below major resistance.
I want the system to recognize that difference rather than treating every strong stock as an equally attractive opportunity.
But one of the biggest improvements is historical market intelligence.
V4 can preserve historical market observations and examine how conditions change between them.
That opens the door to questions that a simple daily dashboard cannot answer.
For example, when a stock's relative strength begins accelerating, does that usually lead to better future performance?
When a sector starts attracting broader participation, are we seeing the beginning of sustainable leadership or just a temporary rebound?
When relative strength remains high but momentum begins deteriorating, does that increase the probability of a correction?
And does a strong technical structure near support produce better outcomes than an equally strong stock that is already extended?
These are the questions I ultimately want V4 to answer.
Now comes the difficult part. Testing the evidence.
We have already established several predefined research groups representing different changes in relative strength, momentum and market behavior.
The historical data collection and verification process is also progressing.
As of October 27, 466 out of 578 historical source cases have passed independent evidence checks.
That represents approximately 81% of this particular verification stage.
I want to emphasize that this does not mean V4 is 81% finished or that its predictions are 81% accurate.
It means we are making progress toward having historical information we can trust enough to analyze.
And believe me, this part has been much more complicated than simply calculating indicators.
Historical market data can be misleading if you are not careful.
Stock splits, dividends, ticker changes, incomplete price histories and different market closing times can all distort the results.
There is also a problem I take very seriously: using information in a historical test that would not actually have been available when a trading decision was supposed to happen.
That can make a system look much better on paper than it would have performed in reality.
We have identified cases where historical observations cannot legitimately be treated as executable signals because the complete information was only available afterward.
I would rather identify those problems now than publish impressive performance statistics that cannot survive proper verification.
Another limitation is the amount of historical evidence.
The system has preserved real market snapshots, but the observation history is not yet extensive or consistent enough to establish reliable results across different market conditions.
Restoring that regular historical tracking is one of the next priorities.
I need genuine observations collected over time, not reconstructed signals that pretend we knew something before we actually did.
So what comes next?
The immediate work is to finish the remaining historical source verification, resolve the data quality exceptions and restore consistent market observations.
After that, the next major stage is measuring what actually happened after different market conditions and stock structures appeared.
Not just whether a stock went up.
I want to examine how far it moved, how much it declined along the way, how often a setup failed and whether the same behavior appeared consistently across different groups of stocks.
Then those results need to be compared against appropriate alternatives and the existing V3 system.
That is the real objective of V4.
I don't want another dashboard with more indicators, more complicated scores and more attractive colors.
I want a system that can tell me whether a particular combination of market conditions has historically provided useful information, how reliable that evidence is and when that information is no longer worth trusting.
And I want to know when the system is wrong.
Because understanding false signals, failed setups and missed opportunities is just as important as studying the winners.
Where do we stand today?
The research foundation is substantially built. The relative strength, momentum, sector participation, volume, volatility and historical analysis capabilities are in place.
But the empirical performance testing is not finished. We do not yet have validated success rates or proof that V4 produces better investment or trading outcomes.
And until that changes, V3 stays in production. V4 stays in research.
No automatic promotion. No pretending that additional complexity is an improvement. No performance claims before the evidence supports them.
I have invested a lot of time into this project, and I want to build it correctly, even if that means spending more time questioning the system than adding new features.
My goal has always been the same.
Find genuine market leadership earlier, understand when that leadership is strengthening or deteriorating, and identify where the chart offers a reasonable opportunity to act.
The dashboard tells me where to look.
The historical evidence should eventually help me understand which conditions deserve more confidence.
And the individual chart still determines whether there is an actionable opportunity.
V4 is progressing. But it still has to earn its place.
Price first.
Relative strength second.
Theme confirmation last.
My market journal, not financial advice.

The Market Strength System V4 build is finished.
Now comes the harder part.
Proving it.
For the last couple of weeks I have been rebuilding the system in shadow while V3 continued running normally in production.
The construction phase is now complete.
V4 includes the new architecture I wanted:
Adjusted price RS
RS5 and RS10 tactical strength
Absolute vs relative performance
RS velocity and acceleration
Cross sectional percentiles
Historical state tracking
Transition and sequence analysis
Theme breadth
Theme diffusion and concentration
Swing geometry
Volume intelligence
Volatility lifecycle
And the infrastructure required to preserve market states through time instead of looking only at today's screen.
But I want to make one distinction very clear.
Build complete does NOT mean production ready.
Now I move from development into confirmation.
This is where I stop adding things and start asking whether the complete system actually behaves the way it was designed to behave.
The next stage is about running V4 through real market cycles in shadow.
New market data.
New source cycles.
New immutable snapshots.
Repeated state transitions.
Different market conditions.
Different sectors and themes.
Different winners.
Different failures.
Then I compare what V4 sees against what the existing V3 system sees.
I want to confirm:
Data remains clean.
Security identity remains correct.
Historical states remain immutable.
The recurring process works repeatedly, not just once.
New modules do not contaminate each other.
The same inputs reproduce the same outputs.
Changes in classifications can be explained.
The system handles new and disappearing stocks correctly.
And most importantly, the additional information actually improves the screening process.
That last part matters.
I did not spend all this time building V4 just to create a more complicated dashboard.
More data is not automatically better data.
More signals are not automatically better signals.
V4 has to demonstrate that the additional information gives me something useful that V3 does not.
Until that evidence exists:
V3 remains production.
V4 remains shadow.
No automatic promotion.
No assumption that newer means better.
The build is finished.
Now the system has to earn its place.
Price first.
Relative strength second.
Theme confirmation last.
My market journal, not financial advice.

$COHR . I entered at $235, looking for a potential bottom and a recovery over the coming weeks or months. But the reversal is not confirmed yet.
This is an early swing position for me, based primarily on the technical location. I am not trying to call the exact bottom, and I am not treating the recent rebound as proof that the downtrend is finished.
The weekly chart is where my interest started.
Price reached a major support area between approximately $195 and $233. The 2D and daily charts also show established support around $205 to $229, creating an interesting structural confluence.
That is a meaningful location for buyers to respond, and we are finally seeing some reaction.
But here is the important distinction. Strong support does not automatically mean a confirmed reversal.
The weekly trend is still damaged. Price remains below its intermediate moving average Ribbon, and the weekly DRE continues showing TOP / WATCH, with market conditions working against the setup.
On the shorter timeframes, the picture is starting to improve.
The 1D and 2D DRE indicators show BOTTOM / WATCH, while the 4H chart is beginning to develop a more constructive structure with improving short term price behavior.
So there is evidence that selling pressure is losing some effectiveness, but not enough evidence yet to confirm that buyers have taken control.
Now comes the difficult part. Resistance.
The first significant supply area is around $243 to $258, followed by another technical barrier near $264 to $269.
For a larger recovery, the weekly chart has a resistance region around $281 to $319, but I am not treating that as an automatic price target.
The chart needs to earn those higher levels.
What I want to see next is relatively simple.
I want $COHR to hold the recovered $229 to $233 area, build a higher low, and then begin accepting prices above the nearby resistance.
A successful retention test followed by improving daily and 2D structure would give me much more confidence in the position.
If price loses that area, I will be watching the broader $215 to $229 support. A decisive break below the recent $202 to $205 lows would seriously weaken my original bottoming thesis.
And I will not use the existence of a lower weekly support level as an excuse for blind averaging down.
My current chart assessment:
Setup type: Early bottoming attempt at major support.
Structure grade: B-. Strong location, but the intermediate trend still needs repair.
Current entry grade: C+ for a fresh entry. My $235 starter has a reasonable structural explanation, but there is nearby resistance and confirmation is incomplete.
Opportunity score: 6/10, conditional on the recovery continuing.
Action bias: Hold / watch. Any additional exposure needs new evidence, not simply a lower price.
My final read.
I like the location. I like the developing reaction. But I do not yet like the quality of the confirmed trend.
This is a potential recovery trade, not an established new uptrend.
And there is a big difference between identifying a place where a stock could bottom and proving that the bottom is already behind us.
Good location. Early reaction. Unconfirmed reversal.
Now I want $COHR to prove the next phase.
My trading journal, not financial advice.


Another major upgrade I am building alongside Market Strength Radar V4. And this one addresses something I believe is fundamental to relative strength analysis.
Before we can determine whether a stock is genuinely outperforming, we need to answer a much simpler question.
Are we comparing that stock against the right benchmark in the first place?
This is the idea behind my latest project, the Driver & Benchmark Assignment OS.
I have been developing it in parallel with Market Strength Radar V4, and I want to explain what I am trying to achieve, what has already been built and why I believe this matters.
First, let me explain the problem.
When we analyze relative strength, we usually compare a stock against $SPY , $QQQ or a sector ETF.
That is useful, but it doesn't always tell the entire story.
Imagine a stock outperforming the S&P 500 while underperforming the actual industry in which it operates.
Is that genuine stock leadership, or is the company simply benefiting from a strong sector?
Now consider a copper producer, an oil company, a utility or a technology business.
They don't all respond to the same economic forces.
Copper prices, oil prices, interest rates, sector demand and industry conditions can influence these businesses very differently.
And that brings me to the distinction I want my system to understand.
A benchmark and an economic driver are not necessarily the same thing.
A benchmark tells me what the stock should be compared against when measuring relative performance.
An economic driver tells me what external market variable might influence the company's business, profitability or financing conditions.
For example, a utility company might reasonably be compared against a utilities ETF, while interest rates represent a separate economic influence.
A copper producer might be compared against its mining industry, while copper prices represent an important driver of its underlying business.
But even here, the relationship isn't always straightforward.
A mining company that has not started production doesn't have the same direct commodity exposure as an established producer generating revenue.
And a company with contracted revenues may respond differently to commodity price movements than one selling directly into the spot market.
That is why I don't want to assign these relationships automatically based only on a ticker or company description.
I want the system to investigate what the company actually does, how it makes money, which economic forces genuinely matter and whether the available evidence supports those relationships.
And if there isn't enough evidence to establish a reliable driver, I would rather have the system say that it doesn't know.
An honest unknown is much better than a confidently wrong classification.
So what have I built so far?
The system already has an economic research framework, benchmark assignment structures, driver classifications and connections to my existing relative strength engines.
It currently covers 1,318 stock records within the existing V3 architecture.
The driver research infrastructure also contains market variables and calculated relationships covering different economic influences.
But I want to make something very clear.
Having 1,318 populated classifications does not mean all 1,318 have been independently verified and approved.
There is still economic research, data validation and exception handling to complete.
And this is where the project has become much more interesting than I originally expected.
Because while testing the system, I discovered problems that could influence the accuracy of the entire screening process.
One example involved the historical VIX data.
Some recorded volatility values were associated with the wrong trading dates.
That might sound like a minor technical issue, but it is not.
If historical market information is assigned to a date before it was actually available, the calculations can become misleading.
A system can appear accurate while unknowingly using information from the future.
And I absolutely do not want that.
Another issue involved how the system connects individual companies to their assigned economic drivers.
Some classifications could potentially influence downstream decisions without the required level of confirmation.
In other words, a possible economic risk could become an overly restrictive signal before the relationship had been properly validated.
That is something I want to prevent.
A company's exposure to an economic driver does not automatically mean that driver should determine whether I can buy or hold the stock.
The strength of the relationship, the available evidence and the current business conditions all matter.
We also identified cases involving duplicate stock identities, incorrect business descriptions and benchmarks that still require verification.
These are exactly the kinds of problems that can remain hidden when a dashboard looks clean and all the formulas appear to work.
And that is why I am spending so much time testing the system before allowing it to make changes automatically.
The good news is that substantial parts of the technical structure have already passed controlled testing.
We have reproduced the existing calculation chain using frozen market data and tested proposed improvements without unnecessarily changing unrelated stock classifications.
That gives me confidence in the technical direction.
But passing controlled tests is not the same as proving that the entire live system is ready.
So where does the project stand today?
The research and assignment framework is substantially built.
The existing data engines and dashboard connections are working.
The technical safety tests have made meaningful progress.
But the full production publishing process is still blocked until the outstanding data integrity, classification and authorization issues are resolved.
For now, the project remains in its first development phase.
And I am keeping that distinction very clear.
The next stage is about making the system trustworthy, not simply making it bigger.
I want to finish correcting the historical data issues, improve the verification of company identities and benchmarks, establish clearer rules for economic drivers and build a proper review process for uncertain classifications.
Only after that do I want to allow approved assignments to move safely through the connected systems.
And then comes the larger ambition.
Once this process is proven, the next planned phase is expanding the research universe toward approximately 13,000 US securities.
After that, I want to examine how the relative strength calculation infrastructure can support that much larger universe without sacrificing data quality or consistency.
Neither expansion phase has started yet. They remain future objectives, not completed capabilities.
Now, how does this connect with Market Strength Radar V4?
These are separate projects, but they address complementary problems.
Market Strength Radar V4 is being developed to better understand how market leadership develops, strengthens, weakens and changes over time.
The Driver & Benchmark Assignment OS is designed to improve the economic context behind those relative strength comparisons.
One studies the behavior of leadership.
The other helps establish whether we are measuring that leadership against the appropriate references and interpreting the economic influences correctly.
Eventually, I want these capabilities to support a more complete research process.
Not just identifying which stocks are outperforming.
But understanding what they are outperforming, whether the comparison is economically meaningful, which external conditions may influence their businesses and whether the observed strength is worth investigating further.
And I don't want to confuse any of that with a trading signal.
A company can have a strong business, a suitable benchmark, favorable economic conditions and excellent relative strength, yet still offer a terrible current entry.
That final decision belongs to the chart, valuation, position context and risk management.
My current assessment of the project is simple.
We have built a substantial foundation, discovered important weaknesses and demonstrated that several of the proposed safeguards can work.
But the live system is not ready for unrestricted automation, and I am not going to pretend otherwise.
I would rather spend another month correcting the foundations than spend years trusting a system that was producing misleading conclusions.
I started building these tools because I wanted to improve my own investment decisions and avoid repeating mistakes I made when I had less experience.
And I continue sharing the development because I believe the process, including the problems and failures, can be just as useful to other investors as the finished product.
The goal is not to build the most complicated market dashboard.
The goal is to build a research system that helps me understand the market better, identify genuine leadership and make more informed decisions.
And most importantly, a system that knows when the available evidence is not good enough to justify a conclusion.
Market Strength Radar V4 and Driver & Benchmark Assignment OS. Two parallel projects, one common objective: better evidence before better decisions.
Still building. Still testing. Still learning.
Price first. Relative strength second. Theme confirmation last.
My market journal, not financial advice.
🤖 Made with AI


TAPE Vector retweeted

A stock falls and suddenly investors start questioning the moat they were praising at higher prices.
Management gets scrutinized. Risks that were always there start feeling much bigger.
Then the stock rallies.
Now those same risks become easier to ignore. Management looks brilliant, future growth seems more certain, and paying a higher multiple somehow feels safer.
You can see this tension in the AI trade right now. Growth can be real, but that doesn’t mean the capital being spent will generate enough future cash flow per share to justify the valuation.
And sometimes the market has a point. Cash flows might arrive later than expected, or the underlying economics might actually be deteriorating. An intact business can still be overpriced.
That’s why I try to separate what’s happening to the stock from what’s actually happening to the business.
I want to know what changed, what expectations are already priced in, and what return the new price offers for the risk.
A falling stock doesn’t automatically mean a broken business.
And a rising one doesn’t automatically mean a better one.
🤖 Made with AI

TAPE Vector retweeted
The chip can leave the fab long before an AI system is ready to run.
$NVDA designs the accelerator. $TSM manufactures the silicon.
But someone still has to design the boards, networking, power and cooling systems. Components need to be sourced, racks assembled and everything tested before the infrastructure can be deployed.
One failed system test can delay an entire deployment, even when the GPUs themselves work.
That is where the businesses behind the chip come in.
$TTMI supplies circuit boards. Foxconn and $JBL L manufacture at scale. $CLS works across engineering and manufacturing. $HPE sells complete systems, while $PENG helps get AI clusters running.
Different jobs. Different ways to get paid.
AMD’s ZT Systems transaction shows why. $AMD D kept the rack-scale design teams while $SANM acquired the U.S. manufacturing business.
$TSSI shows another distinction. Most of the components it integrates belong to customers. It earns revenue for putting them together without reporting their full hardware value as sales.
That is why revenue growth alone cannot tell us which business captures the most value.
I want to know who has the expertise customers depend on, who carries the capital burden and who can keep earning attractive returns.
The chip gets the headlines.
But making it work is a business of its own.
Business Behind the Business | Part 5

TAPE Vector retweeted
Man, @Tape_Vector has been putting out some seriously good research lately.
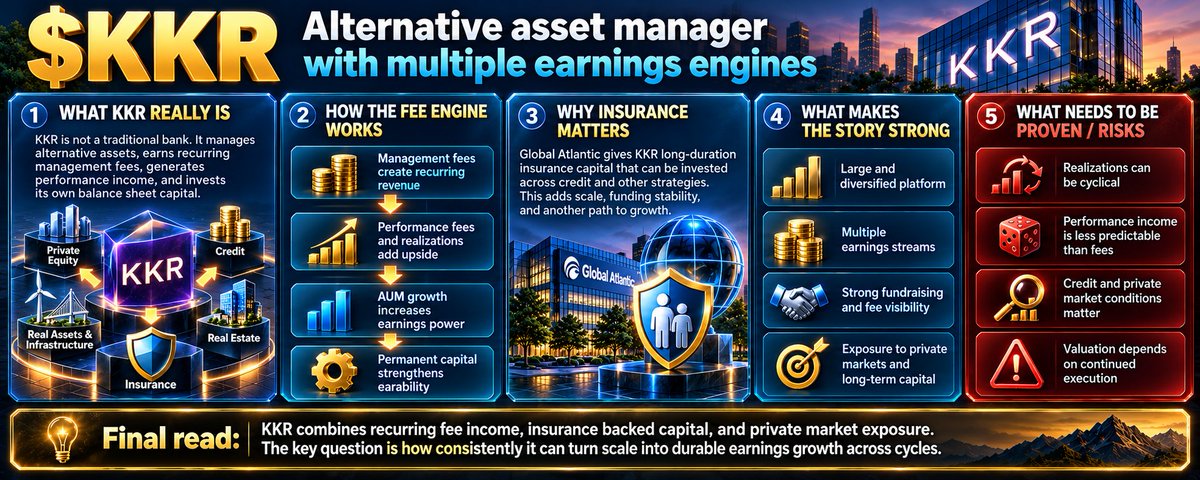
This $KKR breakdown is another fantastic read.
I've spent a lot of time digging into $KKR , Brookfield and Apollo myself, so this one was right up my alley.
What fascinates me about KKR is how its different capital engines work together. Long-duration capital, management fees, Global Atlantic and investment realizations all feeding into the wider business.
But growing the platform and creating value per share aren't necessarily the same thing.
I especially appreciate how he gets into the details that are easy to overlook. The $72B not yet paying fees, the K-Series reporting changes and why the USI realization shouldn't be treated as recurring profit.
His recent $ROP article was another great read. I've owned Roper before and spent plenty of time revisiting the thesis, so I loved seeing him dig into the Indicor gain, revenue quality and debt-funded buybacks.
And these are just two of his articles.
He's been covering everything from $KEY to $COCO, while still putting out his market reads, sector rotation research and leadership radars.
I've actually been using those radars as another input for finding interesting businesses and sectors myself. I especially appreciate how he separates emerging leadership from confirmed strength.
The range of his work is impressive, but what I appreciate even more is the effort he puts into understanding each business beyond the headline numbers.
Seriously, my brother has been on a tear lately 😂
If you enjoy fundamental investing, finding new businesses or understanding what's happening across the market, this is an account you really shouldn't miss.
Go give him a follow. His research is worth your time.
TAPE Vector retweeted

Well well well well.
It’s Tuesday my time to shine before we go cliff diving on Fridays.
I TOLD YOU IM HYPED TODAY NOW FILL THE LEGAL SERVICES DIVISION UP 😤
@DJ_Tao
@mayaivanoff
@Tape_Vector
@TheMarket_Monk
@deplorabletrdr
@PureLogicWealth
@sportsalert
@InvestifyDaily
@MoonWalkerTrd
@banquetsbetter
@ricktheslick67
Strat game strong 💪
#1 in your Finx hearts as well.


$RMBS Q3 2026. Record earnings, strong guidance, and another important piece of the AI infrastructure story.
I went through Rambus's latest financial results and earnings call, and what caught my attention wasn't just the revenue growth. It was what management revealed about server memory demand, CPU infrastructure and the next stage of AI development.
I think this company deserves more attention because it operates in a part of the semiconductor supply chain that is easy to overlook.
First, the financial results.
Rambus reported Q3 revenue of $218.3M, growing 22% year over year and beating the $213.2M consensus estimate.
Adjusted EPS reached $0.84 versus $0.79 expected, while GAAP EPS increased from $0.44 to $0.69.
Product revenue reached a record $114.3M, up 22% year over year and 15% sequentially.
Non-GAAP operating income increased to $102.2M, with operating margin expanding from 44% to 47%.
And something I always like to see, operating cash flow reached a record $102.5M.
These are strong results, but I want to explain what is actually driving them.
What does Rambus do?
Rambus develops semiconductor chips and intellectual property that help computing systems move, manage and secure data.
Think about a modern server.
You have CPUs, memory modules, processors, interconnects and many different components that need to communicate reliably at increasingly high speeds.
As server performance increases, moving data between those components becomes more difficult.
That is where Rambus operates.
Its DDR5 memory interface chips help maintain signal timing and integrity between server processors and memory modules. Its supporting chips handle functions such as power management and module information.
Rambus also develops and licenses semiconductor IP used in high speed memory interfaces, connectivity and hardware security.
The company makes money through three main revenue streams.
Product sales generated $114.3M, primarily from semiconductor chips.
Royalties contributed $77M through licensing arrangements.
Contract and other revenue reached $27M, supported by semiconductor IP and engineering activity.
I like this combination because Rambus participates in both physical semiconductor demand and the development of new chip architectures.
But these revenue streams have different economics, so product growth and royalty growth should not automatically be valued the same way.
Now, here is the most interesting part of the earnings call.
Management expects Q4 revenue between $227M and $233M, with adjusted EPS between $0.84 and $0.92.
Product revenue is expected to reach $127M to $133M.
At the midpoint, that represents approximately 34% year over year product revenue growth.
And the important detail is where this growth is coming from.
Not primarily from some future technology that hasn't reached commercial scale yet.
It is coming from existing DDR5 memory interface chips and supporting components.
Rambus is already benefiting from server memory architecture changes, including higher speeds, additional memory channels and increased chip content per module.
Modern server platforms are expanding from traditional configurations with 8 memory channels toward 12 and 16 channels.
More channels can support additional memory modules, which increases the potential demand for Rambus's interface and control chips.
And this brings me to a broader observation.
AI infrastructure is not only about GPUs.
Management discussed how agentic AI and increasingly complex workloads require more CPU processing, orchestration, data management and conventional system memory.
GPUs perform much of the accelerated computation, but the surrounding infrastructure still needs CPUs and memory to coordinate applications, manage workloads and move information.
That is an interesting read-through for $AMD and $INTC, and also for server manufacturers such as $DELL and $HPE.
It suggests that the expansion of AI infrastructure can support conventional CPU servers rather than simply replacing them.
But this is an industry demand signal, not evidence that every company involved will gain market share or grow at the same rate as Rambus.
There is also an important distinction involving $MU and the broader DRAM industry.
Rambus explained that customers are not necessarily reducing the number of memory modules they use.
Instead, some are reducing the capacity of each module because memory has become more expensive.
Think about what that means.
A server can contain more memory modules, creating additional demand for Rambus's interface chips, while the total amount of DRAM installed grows much more slowly.
More modules do not automatically mean proportionally more memory capacity.
That is important when evaluating memory producers such as $MU, Samsung and SK hynix.
It doesn't mean memory demand is collapsing. Strong pricing and constrained supply can still support profitability.
But it does mean we should not assume that every part of the memory supply chain benefits equally.
And what about MRDIMM?
This is another area where management was more cautious.
MRDIMM offers higher memory bandwidth through a more complex architecture, creating additional opportunities for memory interface suppliers.
But adoption is still early, and Rambus expects a slower ramp than some traditional product generations.
This matters because the company's strong near term product growth does not depend on widespread MRDIMM adoption.
I actually see that as an encouraging distinction.
The existing DDR5 business is already generating growth, while MRDIMM remains a potential future opportunity rather than something I would aggressively include in current earnings assumptions.
The semiconductor IP business is another area worth watching.
Rambus discussed new design wins involving next generation HBM, increasing interest in PCIe connectivity IP, and deeper work with customers developing custom silicon.
It is also expanding its portfolio with power management technology for LPDDR6 SOCAMM2 and hardware security solutions for data centers.
That provides an interesting read-through for the broader semiconductor design ecosystem, including $SNPS and $CDNS.
As AI chips become more complex, companies need more sophisticated memory interfaces, connectivity and security functions.
Some of that engineering work happens well before the finished semiconductor enters production.
But a design win is not the same as guaranteed production revenue, and Rambus's wins do not establish new contracts for its competitors.
Now, let's discuss what I don't like or what still needs verification.
First, product gross margin was approximately 60.4%, toward the lower end of management's near term range.
Supplier costs are increasing, and even a company benefiting from strong demand still needs to protect profitability.
Second, the supply chain is tightening.
Rambus is using its balance sheet to secure additional inventory and maintain product availability. That helps protect customer deliveries, but it also increases the importance of inventory management.
Third, management acknowledged that customers are placing orders earlier than before.
This improves backlog visibility, but earlier ordering is not necessarily stronger final demand.
Customers may be securing components because they are worried about future supply availability.
I want to see that backlog consistently convert into shipments and revenue rather than simply extending purchasing timelines.
Finally, valuation matters.
A strong business can become a poor investment if future growth is already reflected in the stock price. I have not completed the valuation and current chart assessment here, so I am not calling this an attractive entry.
My current read on $RMBS.
The financial performance is strong, the product business is accelerating, and Rambus has a meaningful position in the memory infrastructure supporting modern servers and AI workloads.
The most compelling part is that conventional DDR5 interface demand is already producing results. The company does not need every new memory architecture to succeed immediately for its current business to grow.
But I want to follow product margins, supply costs, customer ordering behavior, MRDIMM adoption and how successfully the company converts its technology roadmap into profitable revenue.
My classification: Tracker. Worth deeper fundamental and valuation research.
For me, Rambus is another reminder that some of the most interesting semiconductor opportunities are not necessarily the companies making the most visible AI processors.
Sometimes the important businesses are the ones making the entire computing system work.
AI needs computing power. Computing power needs memory. And that memory needs increasingly sophisticated infrastructure to function.
That is where $RMBS becomes interesting.
My investing journal, not financial advice.

$RMBS KEY READ-THROUGHS FROM RAMBUS Q3 2026 EARNINGS CALL
Rambus’s results strengthen the case that AI infrastructure spending is broadening beyond accelerators into CPU-based servers, conventional memory modules and increasingly complex silicon designs. The most actionable signal is the expected acceleration in product revenue to 34% year-over-year growth in Q4 despite minimal MRDIMM contributions. However, the call also exposes important differences between module demand, memory-bit demand, supplier profitability and actual end consumption. Customers are preserving module counts while reducing module capacity, semiconductor input costs are pressuring Rambus’s margins, and earlier ordering is improving backlog visibility without resolving uncertainty about downstream inventories. The strongest positive implications concern conventional DDR5 interface suppliers, server processors and advanced semiconductor IP. The strongest negative implications concern aggressive MRDIMM adoption assumptions, unconstrained server-DRAM content forecasts and valuations that treat precautionary ordering as equivalent to final demand. Countries below indicate corporate domicile; magnitude refers to the affected business and consolidated earnings exposure, not a forecast share-price movement.
MEMORY INTERFACE SEMICONDUCTORS: CONVENTIONAL DDR5 CONTENT EXPANSION IS ALREADY MONETIZING, WITHOUT REQUIRING MRDIMM (READ-THROUGH 1)
Affected companies: Montage Technology (688008: China) and Renesas Electronics (6723: Japan). Direction: positive. Magnitude: high strategic relevance for Montage’s concentrated interconnect business; meaningful for Renesas’s memory-interface operations but more diluted at the consolidated level.
The critical evidence is Rambus’s expectation of approximately $130 million in Q4 product revenue, up 34% year-over-year, with management attributing the growth primarily to existing RCD generations and companion chips. Seraphin described the outlook as “34% year-over-year growth based on the core, I would say, RCD and companionships.” MRDIMM remains “very modest.” This is evidence that the conventional memory-interface opportunity is generating substantial revenue before the more speculative architectural transitions become material.
The transmission mechanism is a combination of more populated memory modules, higher-speed RCD generations and increased supporting-chip content. Management highlighted the progression from 8 to 12 to 16 memory channels. A move from 12 to 16 channels increases potential channel count by 33%, although realized module demand depends on population rates and platform mix. RCDs, power-management devices, SPD hubs and temperature sensors can benefit from this expansion without requiring proportional growth in DRAM capacity per module. Renesas’s disclosed portfolio spans these categories, while Montage’s operating exposure is heavily concentrated in interconnect chips.
Montage provides unusually strong independent corroboration. Its October 20 preliminary announcement projected Q3 interconnect-chip revenue growth of approximately 49%, identified higher shipments of DDR5 interface and supporting chips, and anticipated further demand growth in Q4. Interconnect chips represented approximately 98% of its preliminary quarterly revenue, although that category is broader than RCDs alone. Rambus therefore confirms an already-disclosed industry expansion rather than providing the initial evidence for a Montage earnings surprise.
The margin comparison is particularly important. Rambus attributed its approximately 60.4% product margin primarily to supplier-cost pressure, while Montage projected an interconnect gross margin of 68.0% to 68.5%, improving both sequentially and year-over-year. Product mixes and accounting definitions differ, so the figures are not a clean competitiveness comparison. Nevertheless, they demonstrate that Rambus’s margin pressure should not automatically be extrapolated across the entire interface-chip group.
The near-term catalyst is Q4 shipment conversion and the next disclosures on higher-generation RCD mix and companion-chip adoption. The longer-duration driver is rising interface content per server as platforms add channels and memory speeds increase. The cross-portfolio implication is favorable for qualified interface suppliers across China, Japan and the US, but the call does not establish regional share shifts or identify a beneficiary of any specific customer allocation.
MEMORY INTERFACE SEMICONDUCTORS: MRDIMM ADOPTION SHOULD BE MODELED MORE CONSERVATIVELY THAN THE ADDRESSABLE-MARKET NARRATIVE (READ-THROUGH 2)
Affected companies: Renesas Electronics (6723: Japan), Montage Technology (688008: China) and Micron Technology (MU: US). Direction: negative for aggressive adoption and product-mix assumptions. Magnitude: moderate for MRDIMM-specific revenue expectations; limited for immediate consolidated earnings where current contributions remain small.
Management’s clearest qualification was that “the ramp will be shallower in our opinion than the other generations of products.” The reasons were platform-specific introductions, uncertainty about the proportion of systems adopting MRDIMM rather than conventional DIMMs, customer qualification requirements and unfavorable memory economics. Rambus’s strong Q4 growth explicitly does not require a substantial MRDIMM contribution.
The transmission mechanism is delayed monetization of richer module content. MRDIMM introduces multiplexing and additional buffering functionality, creating opportunities for higher interface-chip revenue and differentiated high-bandwidth memory products. However, suppliers realize that opportunity only when compatible processors ship, system vendors qualify the configurations and customers select MRDIMM over conventional alternatives. A large addressable market cannot substitute for those adoption steps.
Renesas has direct exposure through its MRCD and multiplexed data-buffer portfolio, alongside supporting PMICs and other module components. Its July announcement placed production availability for its third-generation MRDIMM chipset in H2 2027. Rambus’s commentary does not contradict that schedule or establish a delay to Renesas’s announced plan. It does reduce confidence in scenarios that assume rapid, broad-based adoption across platforms before customer economics and qualifications are established.
For Montage, the implication is to separate the already-strong conventional DDR5 franchise from incremental MRDIMM upside. For Micron, it argues for caution around the timing of premium server-module mix benefits rather than a reduction in aggregate memory demand. Revenue can remain strong in conventional modules while the richer architecture develops more slowly.
The competitive question is unresolved. An analyst noted that a competitor had secured the initial MRDIMM platform, but Rambus’s response emphasized market timing rather than demonstrating that it had displaced that supplier. Consequently, the call provides no basis for assuming an immediate competitive loss at Renesas or Montage. Equally, early participation in a platform does not guarantee that the entire market will adopt MRDIMM rapidly.
The near-term trading implication is reduced justification for capitalizing a steep MRDIMM ramp into 2027 estimates without shipment evidence. The longer-duration opportunity remains intact. Relevant catalysts are production qualifications, disclosed module shipments and actual adoption across successive CPU platforms during 2027. This is a timing caution, not evidence of canceled platforms or a formal reduction to peer guidance.
DRAM PRODUCERS: MODULE GROWTH IS NOT MEMORY-BIT GROWTH, AND HIGH PRICES ARE ALREADY CHANGING CONFIGURATIONS (READ-THROUGH 3)
Affected companies: Micron Technology (MU: US), SK hynix (000660: South Korea) and Samsung Electronics (005930: South Korea). Direction: negative for unconstrained conventional server-DRAM content assumptions, while near-term pricing can remain positive. Magnitude: potentially meaningful within server DRAM, but not sufficient to establish a consolidated earnings downgrade.
The most important quotation is: “it’s not that people decrease the number of modules, but they tend to decrease the capacity of each one of these modules.” Management attributed that behavior to memory economics. This is a direct indication that customers are protecting bandwidth-oriented configurations while reducing capacity to manage system cost.
The transmission mechanism differs materially between interface-chip suppliers and DRAM producers. Interface-chip demand is substantially linked to the number and configuration of modules. DRAM-bit demand also depends on capacity per module. More modules can therefore support strong RCD shipments while generating much less memory-bit growth. Illustratively, 20% growth in modules combined with a 15% reduction in average capacity produces only 2% growth in installed bits. Those percentages are a sensitivity, not an estimate of the observed market.
This is not a high-conviction outright bearish call on memory earnings. Lower capacity growth can coexist with strong pricing, richer product mix and rising profitability when supply remains constrained. The read-through is specifically negative for models that simultaneously assume unrestricted bit-content growth, rapidly rising prices and no customer adaptation. It also should not be transferred to HBM, whose configurations and demand drivers differ from conventional CPU-attached memory.
The novelty is limited but useful. Micron’s September earnings call had already described strong server-unit growth accompanied by a modestly lower rate of content growth than previously expected because of tight memory supply. Rambus provides independent, module-level corroboration of that adjustment. It is therefore stronger evidence for the mechanism, not a newly discovered reason to cut Micron’s already-reported quarter.
Near-term catalysts are SK hynix’s October 28 results and Samsung’s October 29 earnings discussion, particularly their commentary on conventional DRAM shipments, server configurations and pricing. Samsung’s preliminary profit guidance is already public; the incremental information is the underlying volume, mix and outlook discussion. For Micron, the relevant catalyst is the next update to fiscal 2027 shipments and content assumptions.
The longer-duration implication is that memory spending and useful installed capacity may diverge materially during a tight supply cycle. Across a portfolio, interface-chip strength should not be treated as an interchangeable confirmation of DRAM-bit growth. Conversely, lower capacity per module should not be interpreted as evidence that server deployments or AI infrastructure investment are collapsing.
SERVER PROCESSORS: AGENTIC AI IS EXPANDING CPU-ATTACHED MEMORY DEMAND RATHER THAN SIMPLY REPLACING CPU INFRASTRUCTURE (READ-THROUGH 4)
Affected companies: Advanced Micro Devices (AMD: US) and Intel (INTC: US). Direction: positive. Magnitude: meaningful for EPYC and Xeon demand; moderate incremental consolidated read-through because pricing, market share, supply and other businesses remain important.
Rambus identified orchestration, persistent workloads, tools management and memory management as drivers of higher CPU requirements. Seraphin stated that “the majority of the growth is coming from CPUs with, with standard memory subsystems.” He also described the CPU-to-GPU ratio as moving in Rambus’s favor.
The transmission mechanism is additional CPU-based infrastructure around accelerated workloads. Agent execution requires coordination, data preparation, application logic and access to memory outside the accelerator’s local HBM. Those requirements can increase CPU deployments and favor platforms with greater memory bandwidth, more channels and stronger performance under memory-intensive workloads. AMD and Intel monetize the processor demand; their qualified memory ecosystems help determine how quickly that demand becomes deployed systems.
The distinction between head nodes and the broader CPU estate is important. Rambus characterized LPDDR-based configurations as a smaller portion of the market and conventional DIMMs as the dominant source of growth. This weakens the assumption that growth in specialized accelerator-associated CPU configurations necessarily displaces the broader conventional server opportunity.
However, standard DDR memory is not exclusive to x86. The call supports the end market served by EPYC and Xeon; it does not establish that Arm-based server processors are losing share. Nor does it establish an AMD-versus-Intel share outcome. Rambus’s 34% product-growth outlook also cannot be translated into 34% CPU shipment growth because memory channels, chip content and supplier share contribute to its revenue.
The signal corroborates existing company commentary. AMD’s August release described accelerating EPYC demand, while Intel’s July release reported strong Data Center and AI growth and highlighted agentic infrastructure deployments. Rambus adds a later observation from the memory subsystem, strengthening confidence that the CPU opportunity is supported by actual platform requirements rather than only processor-vendor positioning.
The most immediate catalysts are Intel’s October 29 earnings and AMD’s November 3 earnings. The key variables are CPU demand, shipment capacity and the 2027 outlook, rather than headline data-center revenue alone. AMD’s data-center business also contains accelerators, while Intel’s consolidated outcome includes foundry and other exposures. Over the longer term, the structural positive is a broader CPU workload base; the limiting factors are utilization improvements, workload consolidation and offload to other processors.
ENTERPRISE SERVER HARDWARE: PHYSICAL MEMORY-SUBSYSTEM DEMAND SUPPORTS THE REFRESH CYCLE, BUT DOES NOT VALIDATE HEADLINE REVENUE GROWTH AS UNIT GROWTH (READ-THROUGH 5)
Affected companies: Dell Technologies (DELL: US) and Hewlett Packard Enterprise (HPE: US). Direction: positive for conventional server demand, with important limits on revenue and margin extrapolation. Magnitude: moderate at the server-business level and more diluted at the consolidated level.
The supporting commentary is Rambus’s observation that module counts are increasing even as capacity per module declines, combined with its expectation that conventional CPU systems will generate most of the growth. These are physical configuration signals, not merely higher dollar spending on memory.
The transmission mechanism is demand for complete CPU-based systems used in enterprise refreshes, orchestration and inference-related infrastructure. Dell and HPE can monetize that demand through servers, configuration options, support and related infrastructure. Their exposure is downstream through the server ecosystem; Rambus did not identify either company as the recipient of a particular order or establish a direct customer relationship.
The non-consensus distinction is between genuine infrastructure demand and the magnitude of reported dollar growth. Rambus’s evidence makes an explanation based entirely on memory-price inflation less persuasive. Nevertheless, higher channel counts can increase modules per server without an equivalent increase in server units. The call therefore supports physical infrastructure activity but cannot independently establish OEM unit growth.
This distinction matters against already-reported results. Dell’s September release showed traditional servers and networking revenue increasing 122% year-over-year. HPE also reported strong server growth, and its earnings discussion identified both robust demand and supply constraints. Rambus corroborates the market direction, but provides no basis for applying its own growth rate to those companies or treating their revenue increases as shipment increases.
Margin transmission is also conditional. Higher memory prices can be passed through, absorbed or managed through configuration changes and procurement arrangements. HPE’s recent profitability improvement demonstrates why a blanket conclusion that memory inflation must compress OEM margins would be incorrect. Conversely, continued supply tightness can delay shipments and increase working-capital requirements even when pricing is effective.
The near-term catalysts are the upcoming results covering the October 2026 fiscal quarters, especially unit commentary, traditional-server order conversion, gross profit per system and component availability. The longer-duration positive is a broader role for conventional servers within AI-enabled enterprise infrastructure. The principal cross-portfolio risk is that OEM dollar growth, component shipments and end-system deployment are different measures and should not be counted as independent confirmations of the same growth rate.
SEMICONDUCTOR IP AND DESIGN SOFTWARE: CUSTOM SILICON CREATES EARLIER MONETIZATION OPPORTUNITIES THAN PRODUCTION CHIP SHIPMENTS (READ-THROUGH 6)
Affected companies: Synopsys (SNPS: US) and Cadence Design Systems (CDNS: US). Direction: positive. Magnitude: meaningful for advanced interface and memory IP; modest to moderate at the consolidated level because these are broader businesses and competitive allocation remains unknown.
Rambus reported additional Tier 1 next-generation HBM design wins, increasing interest in PCIe controller and switch IP, and deeper architectural engagement before standards are finalized. Management described customers as “designing increasingly differentiated architectures and tailored silicon optimized for their own environments.” The CFO placed silicon IP growth toward the upper end of the previously communicated 10% to 15% range.
The transmission mechanism is increased demand for validated design building blocks and verification as customers develop more complex custom systems. HBM interfaces, high-speed connectivity, security and integration must be addressed before a chip can reach production. Synopsys and Cadence have direct product exposure to these requirements, rather than merely sharing a broad AI label.
The timing advantage is important. IP licenses and associated engineering activity can monetize during design, before the customer’s finished chip reaches meaningful shipment volume. Design spending can therefore remain strong even while system adoption is constrained by memory supply or platform qualifications. However, licensing terms differ, and design wins should not automatically be treated as recurring royalties on every future chip shipment.
The opportunity is reinforced by previously disclosed peer performance. Synopsys’s August results described a return to year-over-year growth in Design IP and specifically identified memory-interface, wired-interface and security IP within the business. Cadence released its Q3 results on October 26, reporting strong double-digit growth across product categories and record backlog. Rambus is consequently corroborating an established design-demand cycle, not predicting Cadence’s already-announced quarter.
There are clear limits to the read-through. Rambus’s wins could represent competitive displacement in individual programs, so they do not establish that Synopsys or Cadence won the same business. The 35% growth in Rambus’s contract-and-other line is also not an appropriate growth assumption for the entire IP industry, since Rambus’s IP revenue spans multiple accounting categories.
The near-term catalysts are Synopsys’s fiscal Q4 results and subsequent 2027 outlooks, with emphasis on IP bookings, program breadth and integration intensity. The longer-duration positive is greater engineering content per custom system. Rambus’s ChipAgents collaboration does not establish displacement of incumbent EDA tools or a quantified reduction in industry design spending; neither conclusion deserves financial credit from this call.
CROSS-PORTFOLIO SUPPLY-CHAIN RISK: EARLIER ORDERING IMPROVES PLANNING BUT DOES NOT PROVE STRONGER FINAL CONSUMPTION (READ-THROUGH 7)
Affected companies: Rambus (RMBS: US), Montage Technology (688008: China) and Renesas Electronics (6723: Japan). Direction: negative for the evidentiary quality of backlog-based growth assumptions, not evidence of an imminent demand decline. Magnitude: moderate for visibility and valuation; potentially more material for focused interface-chip suppliers if ordering later normalizes.
The decisive exchange concerned downstream inventories. Management acknowledged, “It’s very hard to determine,” before explaining that customers are placing orders earlier. Seraphin summarized the distinction as: “we don’t see people building inventory, but we see people placing backlog.” That is narrower than confirmation that downstream inventories are lean.
The transmission mechanism is a change in order timing. Customers responding to longer supplier lead times can extend procurement horizons without increasing the same proportion of final consumption. Suppliers then see stronger backlog and may build inventory or reserve capacity. If customers subsequently shorten those horizons, bookings can weaken even while underlying end demand remains healthy. Precautionary ordering can therefore amplify both the apparent upturn and a later normalization.
Rambus’s own actions illustrate the balance-sheet consequence. Inventory increased approximately $12 million during Q3, another increase is planned for Q4, and management is using liquidity to protect supply. This strategy has worked operationally: management stated that supplier constraints did not affect Q3 or the Q4 outlook. The negative read-through is therefore not a reason to assume an immediate supply-driven miss. It is a reason to distinguish current execution from the durability of the visible order book.
The risk cannot be transferred mechanically across suppliers. Contract terms, cancellation provisions, customer deposits, product breadth and inventory ownership differ. In particular, memory producers’ disclosed longer-term supply commitments should not be treated as equivalent to Rambus’s unspecified product backlog. Nor does Rambus’s limited visibility prove that Montage or Renesas has the same customer behavior.
The near-term catalyst is the Q4-to-H1 2027 transition, when seasonal patterns, inventory coverage and earlier orders begin to interact. Shipment conversion, cancellations and inventory efficiency will be more informative than backlog growth alone. Over the longer term, suppliers that can maintain availability without excessive inventory commitments should earn better returns on capital. The cross-portfolio implication is to avoid counting stronger CPU demand, higher module shipments and longer component backlogs as 3 fully independent signals when they can reflect different stages of the same procurement cycle.

$AMKR Q3 2026. The earnings missed expectations, but the semiconductor supply chain story is much more interesting than the headline numbers.
First, the financial results.
Revenue reached $1.99B, practically unchanged from last year and slightly below the $2.01B expected. EPS came in at $0.76 versus $0.78 expected, while gross margin of 18.3% also missed estimates.
Not a clean earnings beat.
But here is what caught my attention. Gross margin improved from 14.3% last year to 18.3%, operating margin expanded from 8.0% to 11.3%, and EPS increased from $0.51 to $0.76.
Revenue is flat, but profitability is improving.
That tells me the business mix is becoming increasingly important. Amkor is generating better returns from higher value packaging activity, even while some of its traditional markets are struggling.
And this is where the semiconductor story gets interesting.
Amkor is not designing GPUs or manufacturing the silicon wafers. It sits further down the supply chain, providing semiconductor packaging and testing.
After chips are manufactured, they still need to be interconnected, assembled into usable packages and tested. Advanced packages can integrate multiple dies, memory and high bandwidth connections into increasingly complex systems.
That becomes critical as AI processors require more computing power, bandwidth and energy efficiency.
And according to management, advanced packaging capacity is becoming an increasingly important constraint.
Computing is the strongest part of the story.
Computing represented 26% of revenue and grew 37% year over year. Management continues ramping its advanced CPU packaging programs, with additional networking and data center projects entering production.
The company expects Computing revenue to grow approximately 30% or more in 2027.
Even more interesting, customers are making longer term capacity commitments and providing advance payments to help secure future production.
$NVDA is a major example.
Amkor recently announced an additional $1.3B agreement supporting capacity in South Korea, bringing its multiyear agreements with Nvidia across South Korea and Arizona to $3B.
For me, this matters because it shows how important securing advanced packaging capacity has become.
But an agreement to fund future capacity is not the same as current revenue. Those facilities still need equipment, qualification, acceptable production yields and actual customer volume.
There is also a read-through for $TSM.
Amkor's Arizona expansion complements TSMC's US manufacturing footprint. Producing silicon wafers domestically is only part of the process if advanced packaging and testing still need to happen elsewhere.
This could strengthen the US semiconductor supply chain over time, but most of the benefits depend on execution in 2027, 2028 and beyond.
Another area I am watching is semiconductor equipment.
More complex packaging creates greater requirements for inspection, metrology and process control.
That makes companies such as $CAMT and $ONTO interesting businesses to investigate further.
But I want to be precise here. Amkor's growth supports the broader demand argument. It does not prove that those companies have received additional orders from Amkor specifically.
Automotive is another positive development.
Automotive and Industrial represented 22% of revenue, growing 37% year over year.
Management highlighted demand for advanced driver assistance, infotainment and increasing semiconductor content inside vehicles.
This supports further research into companies such as $NXPI and $QCOM, although stronger packaging demand does not mean every semiconductor supplier will experience the same growth.
Now, the weaker side of the report.
Communications represented 37% of revenue, down from 51% last year.
Amkor is dealing with component shortages, higher memory costs, changing customer production schedules and the relocation of some packaging activities.
Management expects both Android and iOS related activity to weaken sequentially in Q4.
That has implications for companies exposed to smartphones, including $AAPL, $QCOM and MediaTek.
But I would not immediately interpret that as collapsing consumer demand. Supply constraints, production timing and changes in packaging locations all influence Amkor's reported revenue.
The PC market is also relatively soft, even while data center computing remains strong.
So what is the main risk for $AMKR?
Capital intensity.
The company expects approximately $2.5B in capital expenditures during 2026, with further expansion planned across Arizona, South Korea and Vietnam.
Customer advance payments help finance those investments, but they do not eliminate execution risk.
New facilities must eventually produce enough profitable revenue and cash flow to justify the capital deployed.
That is the distinction I want to follow.
My current read.
I see a company improving its profitability through a better business mix, supported by genuine demand for advanced semiconductor packaging.
Computing and automotive are providing meaningful strength. Smartphones and consumer electronics remain weak. And future growth requires substantial capital investment.
The strongest investment thesis is not simply that AI demand is growing. It is that advanced packaging is becoming more strategically important, and qualified manufacturing capacity may have greater economic value.
But I still need to separate business quality from valuation and chart structure.
For now, $AMKR remains an interesting company to track through the next stage of its expansion.
What I want to see next is continued computing growth, stronger margins, successful production ramps and evidence that capital spending eventually converts into sustainable free cash flow.
Strong industry demand is encouraging. Profitable execution is what ultimately matters.
My investing journal, not financial advice.
You're unable to view this Tweet because it's only available to the Subscribers of the account owner.
$SOFI Q3 2026. Strong earnings, raised guidance, and finally a clearer picture of 2027. But will the market reward it this time?
This is the question I had going into today's earnings report.
In April, $SOFI delivered strong revenue growth, yet the stock dropped 15.4%. In July, another revenue beat was followed by an 8.9% decline.
The problem wasn't simply the quarterly results. Investors wanted stronger evidence that revenue growth would translate into higher earnings per share.
Today, SoFi delivered another strong quarter.
Adjusted net revenue reached $1.37B, growing 44% year over year, while adjusted EPS came in at $0.18. GAAP net income reached $241M, and adjusted EBITDA increased 70% to approximately $470M.
The customer numbers are also impressive. Members increased 35% to 17.1M, while total products grew 44% to 26.7M. Total deposits reached $51.3B.
But I want to look beyond the headline numbers.
The business segments tell an important story.
Lending revenue grew strongly, supported by increased loan originations and demand. Financial Services revenue increased 25%, showing continued expansion of the broader banking ecosystem.
Fee-based revenue reached approximately $571M. This matters because SoFi is trying to build a business that earns money from more than simply holding loans on its balance sheet.
However, not everything is improving.
Technology Platform revenue declined approximately 24% to $87M. This remains a weak part of the business, and I want to see evidence of stabilization rather than assuming the problem will resolve itself.
Now comes the most important part of the report. Guidance.
For 2026, management increased adjusted revenue expectations to approximately $5.04B, compared with the previous $4.75B to $4.85B range.
But adjusted EPS guidance moved only slightly, from $0.60 to $0.61.
That is worth emphasizing. The revenue outlook improved substantially, but the near term earnings outlook barely changed.
The more interesting development is 2027.
Management introduced preliminary expectations of approximately $6.4B in adjusted revenue and $0.90 in adjusted EPS.
That gives investors a clearer view of the earnings growth management believes the business can deliver.
But these are forecasts, not profits already earned. Execution, credit quality, funding costs and the weaker Technology Platform segment still matter.
And what is the market saying?
At the time of the initial premarket reaction, $SOFI was trading around $15.32, approximately 5% above Monday's $14.46 close.
That is encouraging, especially after the negative reactions to the previous earnings reports.
But I am not calling this a confirmed reversal based on premarket trading.
I want to see how the stock reacts during the earnings call, what management says about the 2027 targets, and whether buyers can sustain the move throughout the regular session.
For this immediate earnings reaction, Monday's $14.46 close is an important reference. A move back below it would seriously weaken the argument that this report has changed short term market sentiment.
My current read:
The business continues to demonstrate strong growth, improving profitability and increasing customer adoption.
Management has finally provided a more meaningful longer term earnings target, although the 2026 EPS upgrade remains modest.
The Technology Platform weakness still deserves attention, and valuation must be judged against earnings that are actually delivered, not just projected.
For me, this is a positive fundamental development, but strong business performance and a good stock entry are still two different things.
The earnings report gives me more information about the business.
Now I want the market to tell me whether expectations are finally changing.
Good numbers are not enough. Guidance matters. Price confirmation matters.
My investing journal, not financial advice.

$SOFI just delivered one of the most INSANE earnings reports I’ve ever seen.
• Revenue beat by 9% ✅
• EPS beat by 6% ✅
• 2026 guidance raised ✅
• 2027 revenue & EPS guidance WAY above estimates ✅
And the market is still valuing this company at just 15x forward earnings.

TAPE Vector retweeted

$SOFI just answered the only question that mattered
last night: they beat revenue twice this year and still dropped. -15.4% in april, -8.9% in july. the open question was whether the $0.60 EPS target finally moves
q3: adjusted net revenue $1.37B, up 44%. adjusted EPS $0.18. gaap net income $241M
2026 guide: revenue to $5.04B from $4.75-4.85B. EPS only ticks to $0.61, but they put a 2027 number on it: $0.90
stock is about +5% premarket at ~$15.32. that breaks the last two report-day patterns, at least so far
the question now isnt the beat. its whether this holds through the 7 AM CT call and the open
what would prove me wrong: fade back under monday's $14.46 close by the end of the day
#dyor
full breakdown of the prior pattern: youtu.be/p2aCWLpbnas

One news alert, one decision, and a few percentage points of potential losses avoided on $META.
This is a good example of why I keep exploring different tools for my investing and swing trading.
Over the weekend, I had the pleasure of testing Top Tier Newswire app.toptiernewswire.com/ a financial news terminal built by @Atlantastanian.
And I have to say, it has already proved useful to me in a very practical way.
Before going further, this is NOT a paid partnership or sponsored promotion. I am simply sharing another tool I personally use because I believe other traders and investors might find it useful too.
Let me explain what happened with $META.
Yesterday, October 26, Meta announced a major financing plan involving new stock offerings to support its AI infrastructure investments.
I already had my fundamental research done. I knew the business, understood the investment thesis and had been following the developments around its capital requirements.
What I wasn't prepared for was how quickly this financing announcement would arrive.
And this is where Top Tier Newswire made a difference for me.
I saw the news through the terminal before I came across it anywhere else in my normal research workflow.
When I saw $META trading around $654, I placed a sell limit at $650, and my order was executed.
By the end of the session, $META was trading around $630.
That is approximately $20 per share between my execution and the subsequent closing price.
Now, I am not claiming that I perfectly timed the market or that I knew exactly where $META would go next.
But I had already done my research, I understood the implications of additional equity financing, and the news gave me a reason to act sooner than I had originally planned.
The terminal didn't make the investment decision for me. It helped me receive information in time to make my own decision.
And for me, that difference alone was worth many months of access to the platform.
This is exactly why timely information matters.
You can spend weeks researching a company, understanding its financials, studying its chart and building an investment thesis. But an important announcement can change the situation much faster than you expect.
Sometimes the difference between reacting early and finding out later can be meaningful.
So what does Top Tier Newswire actually offer?
The first thing that caught my attention was the live newswire.
Instead of constantly jumping between financial websites, X, company announcements and other news sources, I can follow an organized stream of market developments in one place.
Headlines are associated with relevant tickers, and the platform adds AI sentiment classifications to help identify potentially important developments.
For example, if I am monitoring $META, $NVDA or another company in my portfolio, I can look for relevant announcements without manually searching every source throughout the trading day.
Then there are the watchlists and alerts.
This is particularly interesting for someone like me because I follow a large number of companies through my screening and research systems.
I may already know which stocks deserve attention, but I cannot constantly watch every company's news flow.
Having a dedicated news monitoring tool adds another layer to that process.
The platform also brings together several other useful features.
There is an options flow dashboard where you can examine unusual activity and larger option transactions.
You can follow financial discussions and market developments coming from X and other social platforms.
There are tools for monitoring insider transactions, congressional trading disclosures and other publicly reported activity.
The terminal also includes market heatmaps, sector performance, trending stocks, earnings calendars, economic events and stock scanners.
And there is an AI Top Trades section that ranks potential long and short candidates based on information gathered from different sources.
I find that interesting as an additional research input, although I would never treat an AI ranking or sentiment score as an automatic trading signal.
What interests me most is how these different sources can work together.
Imagine you already have a stock on your watchlist.
You have studied its fundamentals, identified important technical levels and know the conditions under which you would consider acting.
Then an important announcement appears.
Instead of discovering it hours later while checking your usual websites, you have another way to become aware of the development and reassess your plan.
That is where I see the real value.
Not in trying to predict every market move, but in reducing the time between important information becoming available and my ability to evaluate it.
Of course, I still verify the original sources.
AI generated sentiment can be wrong, ticker associations can be inaccurate, and an unusual options transaction does not automatically tell us what institutions expect to happen.
I have only recently started using the platform, so I am not going to pretend that I have tested every feature or independently verified every performance and speed claim.
But my experience with $META was a very good start.
And it reinforced something I have been saying for a long time.
Good research prepares you for a decision. Timely information helps you recognize when that decision needs to be made.
One without the other can leave you exposed.
I still use my own market screening systems, TradingView indicators, fundamental research and portfolio management process. Top Tier Newswire is not replacing those tools.
It is becoming another part of how I monitor the market.
And if it helps me avoid even a few unnecessary mistakes or become aware of important developments earlier, that is valuable to me.
So a big thank you to @Atlantastanian for building Top Tier Newswire.
I appreciate people who put their time and knowledge into creating tools that other market participants can actually use.
For anyone involved in swing trading, investing or following financial markets closely, I think this is another platform worth exploring.
app.toptiernewswire.com/
Again, not a paid promotion. Just sharing my experience with a tool that has already helped me make a better informed decision.
And I will continue testing it, just like I do with every other tool I add to my research workflow.
Research gives me the plan. News gives me new evidence. Price and risk determine my action.
My investing journal, not financial advice.


TAPE Vector retweeted

$STX $WDC: the "dead" hard drive stocks almost beat $NVDA 🤯
5 year return:
$NVDA: up 800%
$WDC: up 727%
$STX: up 634%
For years everyone said flash would kill spinning disks. Then AI showed up, and all that data needs somewhere cheap to live.
The twist: Seagate is down 30.3% in the last month, and it reports tonight after the close.
Buy the dip before earnings, or wait for the numbers? 👇

🚨 STOCK SPECIFIC STRENGTH: Individual stocks are still outperforming, but the broader sectors are not confirming.
The independent strength universe has narrowed slightly.
Small clusters remain visible in industrials, consumer discretionary, financial technology, semiconductors, materials and communication services.
But the focused chart review list has become less clean.
The stocks are showing strength. Their supporting themes are still not providing the same confirmation.
The breakdown:
📊 The Independent Strength Picture
The Stock Specific Strength universe now contains 186 screening entries, representing 185 unique stocks.
That is down from 191 entries in the previous October 23 update.
Current evidence:
• 152 entries have aligned positive individual relative strength.
• 34 have mixed but positive relative strength.
• 164 remain under weak supporting theme trends.
• Another 22 have mixed but weak theme trends.
All 186 entries remain under mixed broader market conditions.
Individual stocks are separating from their surroundings.
But independent strength is not the same as broad sector leadership.
A stock can outperform while its peers, benchmark or supporting theme remain weak.
That is useful evidence.
It is not permission to generalize.
The stock is doing its job. The wider group has not confirmed.
🛡️ Where Independent Strength Is Concentrated
The six largest clusters:
• Industrials (XLI): 30 stocks
• Consumer discretionary (XLY): 15
• Financial technology (FINX): 13
• Semiconductors (SOXX): 13
• Materials (XLB): 13
• Communication services (XLC): 13
These groups account for 97 of the 186 screening entries, approximately 52% of the universe.
The main changes from the October 23 update:
• $XLI: 31 → 30
• $XLY: 18 → 15
• $FINX: 16 → 13
• $SOXX: 16 → 13
• $XLB: 15 → 13
The largest independent strength clusters have lost some participation.
But these are changes inside the screening categories, not proof of money moving out of those sectors.
XLI remains the largest source of individual outperformers.
XLY, FINX, SOXX and XLB continue to produce smaller clusters.
The important question is whether more stocks inside these groups begin confirming the same relative strength.
For now, small clusters remain visible, but broad sector confirmation is still missing.
🎯 The Focused Chart Review Funnel
The experimental V3.1 shortlist still contains 30 unique stocks.
Current opportunity states:
• 22 Best Positioned Independently
• 8 Close to Independent Confirmation
• 0 Building Independent Strength
Compared with the October 23 published update:
• Best Positioned: 24 → 22
• Close to Confirmation: 6 → 8
• Focused list size: 30 → 30
The review list remains full, but immediate chart readiness weakened.
Technical structure:
• 16 strong uptrends
• 10 uptrends
• 4 repairing charts
Current extension:
• 16 normal extension conditions
• 9 pullbacks
• 4 stretched charts
• 1 deep pullback
Liquidity:
• 18 high liquidity
• 6 normal liquidity
• 6 limited liquidity
There is an important distinction.
The focused stocks are technically constructive in many cases.
But all 30 still have conditional broader market support.
Their supporting theme trends also remain weak or mixed weak.
29 of the 30 have aligned individual relative strength. Only one has mixed but positive relative strength.
The stock evidence is strong.
The wider confirmation gap remains.
There is another useful observation.
The larger universe is dominated by XLI.
But the focused selection has its biggest concentrations in XLY, XLB and XLC.
The largest pool of independent outperformers is not necessarily the area providing the largest number of currently usable chart setups.
Structure quality and current entry quality remain separate questions.
🔎 The Charts I Am Opening First
Materials (XLB): $1303, $ECL
$1303 has aligned individual relative strength, a strong uptrend, a pullback and high liquidity.
Its primary relative strength reading is approximately +124.4%.
There is also supporting driver evidence.
That makes it one of the more interesting independent strength charts in the current selection.
But the materials theme remains weak.
The stock is showing strength that its wider group has not matched.
$ECL also has aligned relative strength, a strong uptrend, normal extension and high liquidity.
Its driver evidence is supportive.
These are two different chart locations inside the same broader materials group.
I still need to validate support, resistance and available room.
Industrials (XLI): $FAST, $MTW
$FAST has a strong uptrend, normal extension and high liquidity.
$MTW also has a strong uptrend, but it is currently in a pullback with normal liquidity.
Both have aligned individual relative strength.
The technical structures are constructive.
But XLI remains weak as a supporting theme in this screening system.
The important question is whether these are isolated company level moves or early evidence of wider industrial participation.
The charts deserve attention.
The broader sector conclusion remains conditional.
Financial Technology (FINX): $IDT
$IDT has aligned individual relative strength, a strong uptrend, a pullback and high liquidity.
Its primary relative strength reading is approximately +51.2%.
That is meaningful individual outperformance.
But the supporting financial technology theme remains weak.
I want to see whether the pullback offers a controlled entry location with enough room to resistance.
Strong relative strength does not eliminate entry risk.
Semiconductors (SOXX): $SWKS
$SWKS has aligned individual relative strength, an uptrend, normal extension and high liquidity.
There is also supportive driver evidence.
The stock is providing useful evidence.
But the semiconductor theme remains mixed and weak.
That distinction matters.
A semiconductor stock outperforming independently is not proof that semiconductor leadership has broadened.
Consumer Discretionary (XLY): $GCT
$GCT has aligned individual relative strength, a strong uptrend, normal extension and high liquidity.
Its primary relative strength reading is approximately +29.9%.
The structure is constructive.
But supporting theme confirmation is still missing.
I want to see whether price is close enough to a defensible support area and whether there is sufficient upside room.
Communication Services (XLC): $VEON, $ROKU
$VEON has a strong uptrend, normal extension and normal liquidity.
Its primary relative strength reading is approximately +59.7%, with supportive driver evidence.
$ROKU has an uptrend, normal extension and high liquidity.
Its primary relative strength reading is approximately +42.7%.
Both are showing independent strength while XLC remains weak as a supporting theme.
Different stocks. Different businesses.
The common feature is relative outperformance without broader theme confirmation.
That is worth investigating.
But I still need to understand the individual business reasons behind these moves before forming a stronger investment thesis.
⚠️ The Entry Quality Warning
Several focused stocks have strong individual relative strength but imperfect current locations.
$VIA, $TBCH and $V
All three have strong uptrends, but they are stretched.
A strong trend does not automatically create a favorable new entry.
$EDHL
The chart is repairing and stretched.
Liquidity is also limited.
That combines structure uncertainty with execution risk.
$3016
The Taiwanese listing has aligned individual relative strength and an uptrend, but it is in a deep pullback.
It remains Close to Independent Confirmation.
I want to see whether support holds and the structure begins repairing before treating it more aggressively.
Liquidity also deserves attention.
$MTLS, $VRA, $NTTYY, $7609, base:0x1e925de1c68ef83bd98ee3e130ef14a50309c01b and $EDHL are classified as having limited liquidity.
High relative strength does not eliminate spread, slippage or execution risk.
For these names, the quality of the actual trade location matters even more.
Good stock, bad current location is still a reason to wait.
No blind chase.
No automatic entries.
📋 Focused Stock Specific Strength Watchlist | 30 Stocks
These are the 30 selected stocks from the larger Stock Specific Strength universe.
Best Positioned Independently | 22 Stocks
$1303, $MTLS, $VEON, $MTW, $IDT, $ROKU, $VRA, $8996, $GCT, $NTTYY, $LXFR, $SWKS, $FAST, $PM, $KO, $7609, base:0x1e925de1c68ef83bd98ee3e130ef14a50309c01b, $ECPG, $ECL, $AI, $SLAB, $MDLZ
Close to Independent Confirmation | 8 Stocks
VIA, EDHL, $3016, VSXY, TBCH, ODD, V, HEI
TradingView copy and paste format:
TWSE:1303,NASDAQ:MTLS,NASDAQ:VEON,NYSE:MTW,NYSE:IDT,NASDAQ:ROKU,NASDAQ:VRA,TPE:8996,NASDAQ:GCT,OTCMKTS:NTTYY,NYSE:LXFR,NASDAQ:SWKS,NASDAQ:FAST,NYSE:PM,NYSE:KO,TYO:7609,EPA:EXA,NASDAQ:ECPG,NYSE:ECL,EPA:AI,NASDAQ:SLAB,NASDAQ:MDLZ,NYSE:VIA,NASDAQ:EDHL,TWSE:3016,NYSE:VSXY,NASDAQ:TBCH,NASDAQ:ODD,NYSE:V,NYSE:HEI
The list preserves the exchange-qualified symbols and selected order from the experimental V3.1 shortlist.
These are chart review candidates, not automatic buy signals.
The experimental shortlist passed its selected-stock data checks. That does not prove superior future returns.
📌 The Verdict
Stock Specific Strength narrowed to 186 screening entries, representing 185 unique stocks.
The largest independent strength concentrations remain in XLI, XLY, FINX, SOXX, XLB and XLC.
The focused chart review list still contains 30 stocks.
But Best Positioned Independently declined from 24 to 22 compared with the October 23 update.
Four charts are now stretched, and six focused names have limited liquidity.
The individual stock strength remains visible. The number of cleaner immediate opportunities has weakened slightly.
More importantly, the supporting sectors and themes are still not confirming.
That is the central limitation.
This remains selective stock strength in a mixed market, not confirmed broad leadership.
What would strengthen the picture?
• More individual outperformers appearing inside the same themes.
• Better sector and peer confirmation.
• Stronger benchmark alignment.
• Cleaner weekly and daily chart structures.
• Better current entry locations.
I also want to understand why these individual stocks are outperforming.
Where the business reason is not established, it still needs research.
A strong chart is evidence of market behavior.
It is not automatically evidence of improving business fundamentals.
Next comes manual validation of weekly and daily structure, support, resistance, available room, liquidity and failure levels.
Only charts that survive that review move into deeper company research.
The October 27 refresh is anchored to the completed October 26 U.S. market session. Selected Taiwanese and Japanese listings carry October 27 price dates, while the selected French listings carry October 23 dates. This is not a simultaneous global closing snapshot.
Deep dive & support the radar: buymeacoffee.com/tapevector
My market journal, not financial advice.
The stock is giving me a reason to look.
The theme is not giving me permission to generalize.
Price first. Relative strength second. Theme confirmation last.
🤖 Made with AI


TAPE Vector retweeted

$COST
For the first time in a long while, it was actually very close to a real correction. But as news flow changed and investors sought safe havens, the double top structure evolved back into consolidation ahead of a breakout

🚨 FUTURE LEADER RADAR: The themes are showing strength, but many individual stocks are still falling behind.
The Future Leader Radar currently contains 183 screening entries, representing 181 unique stock symbols.
The universe has narrowed from 192 entries at the last frozen October 14 checkpoint.
But the main issue has not changed.
The themes are working. The stocks are not consistently keeping up.
Some stocks are beginning to respond. Others remain in repair. A few have constructive price structures but still lack sustained relative strength.
The experimental V3.1 focused shortlist contains 30 stocks.
• 10 Best Positioned to Catch Up
• 20 Close to Catch Up Confirmation
• 0 Early Catch Up Candidates
This is a radar for potential future participation, not a list of confirmed leaders.
The breakdown:
📊 The Future Leader Radar Picture
The universe decreased from 192 to 183 screening entries, a reduction of 9 compared with the last frozen checkpoint.
The evidence shows a clear imbalance.
• 157 entries have aligned supporting theme trends.
• 26 have mixed but positive theme trends.
• 143 have weak individual relative strength trends.
• 29 have mixed but weak individual relative strength.
• 10 have missing relative strength readings.
Only one entry has a mixed but positive individual relative strength trend classification.
All 183 remain under mixed broader market conditions.
This is the central message.
Theme strength is considerably more established than individual stock participation.
The supporting themes are showing positive evidence, but the individual stocks are not consistently matching that strength.
That does not necessarily mean every stock is falling.
Some are rising in absolute price while still underperforming their benchmarks or lacking consistent relative strength across multiple windows.
The theme gives me a reason to investigate.
The stock still needs to prove its own leadership.
🧭 Where Future Participation Is Concentrated
The six largest theme pools:
• $IGV: 28 stocks, software
• $XLV: 25, healthcare
• $XBI: 24, biotechnology
• $XLK: 24, technology
• $XLE: 14, energy
• $ARKG: 12, genomics
These six groups account for 127 of the 183 entries, approximately 69% of the universe.
The four largest alone account for 101 entries.
Software, healthcare, biotechnology and technology dominate the future participation pool.
But this requires careful interpretation.
A large number of lagging stocks inside a strong theme does not make the theme weak.
It means the theme is providing support while many individual stocks still have incomplete participation.
IGV and XLK
Technology related themes contain substantial pools of stocks that have not fully matched their supporting groups.
Some are repairing. Others show constructive price behavior without sustained benchmark outperformance.
XLV, XBI and ARKG
Healthcare and biotechnology contain another large pool of potential future participants.
A few individual stocks already have constructive uptrends.
But the difference between current chart strength and full relative strength confirmation remains important.
XLE
Energy also contains lagging individual stocks despite supportive theme evidence.
The theme is giving me a reason to look.
The stock still needs to prove it can participate.
This is concentrated potential participation, not confirmed broadening of stock leadership.
🎯 The Focused Catch Up Funnel
The experimental V3.1 shortlist contains 30 stocks.
Compared with the last frozen October 14 checkpoint:
• Focused list: 30 → 30
• Best Positioned to Catch Up: 17 → 10
• Close to Catch Up Confirmation: 12 → 20
• Early Catch Up Candidates: 1 → 0
The number of focused stocks is unchanged.
But the technical quality distribution has weakened.
There are fewer stocks showing immediately constructive catch up conditions.
More now require another step before deeper review.
Current technical structure:
• 10 strong uptrends
• 3 uptrends
• 17 repairing charts
Current extension:
• 19 normal extension conditions
• 2 pullbacks
• 9 stretched charts
Liquidity:
• 24 high liquidity
• 5 normal liquidity
• 1 limited liquidity
There is another important observation.
All 30 focused stocks have aligned supporting theme trends.
But 29 still have weak or mixed weak individual relative strength trend classifications.
Only one has a mixed but positive relative strength trend classification.
That tells me the main limitation is not theme support.
The main limitation is stock level confirmation.
A constructive chart may already be forming.
But the stock is still trying to prove it belongs with the stronger leaders.
🔎 The Charts I Am Opening First
Technology (XLK): $VRSN
$VRSN has a strong uptrend, normal extension and high liquidity.
Its primary relative strength reading is approximately -0.7%.
The relative strength trend classification is mixed but positive.
This is one of the cleaner technical structures in the focused selection.
But stronger benchmark confirmation is still needed.
Good current structure. Stock leadership is not fully proven.
Cloud Software (WCLD): $DDOG, $WEAV
$DDOG has a strong uptrend, normal extension, high liquidity and supportive driver evidence.
Its primary relative strength reading is approximately +20.7%.
But the broader relative strength trend is still mixed and weak.
$WEAV also has a strong uptrend and normal extension, but its primary relative strength reading remains negative.
Both have constructive supporting theme evidence.
Different levels of individual participation inside the same theme.
I want to see more consistent stock strength before treating either as fully confirmed leadership.
Healthcare (XLV): $LLY, $VTRS, $JNJ
$LLY has a strong uptrend, normal extension and high liquidity.
Its primary relative strength reading is approximately +16.5%.
But the relative strength trend remains mixed and weak.
$VTRS also has a strong uptrend and normal extension, while its primary relative strength reading is slightly negative.
$JNJ is in an uptrend with normal extension and high liquidity, but individual relative strength remains weak.
Three different examples of constructive price structure without complete relative strength confirmation.
Biotechnology and Healthcare (XLV): $CLOV
$CLOV has an uptrend, a pullback and normal liquidity.
Its primary relative strength reading is approximately +37%.
That is notable individual performance.
But the relative strength trend classification remains mixed and weak.
Strong performance over one measurement does not prove consistent leadership across every required window.
I want to see whether the pullback creates a controlled entry location and whether broader relative strength becomes more consistent.
Energy (XLE): $DVN
$DVN has a strong uptrend, normal extension and high liquidity.
The supporting theme is aligned.
But its primary relative strength reading is approximately -13.5%.
This is the type of discrepancy the radar is designed to identify.
The theme is working.
The individual stock still needs to close the relative performance gap.
Shipping (BOAT): $ZIM
$ZIM has an uptrend, a pullback and high liquidity.
The supporting theme is aligned.
But the primary relative strength reading remains approximately -14.1%.
The chart may be improving.
That does not mean the stock has already caught up with its theme.
I want stronger participation before upgrading the classification.
⚠️ The Entry Quality Warning
There are several stocks with constructive elements but poor current locations.
$EXEL and $BIIB
Both have strong uptrends, but both are stretched.
$PCOR, $UTHR, $ISRG, $VRSK and $ADSK
All five are repairing and stretched.
They need better positioning or stronger price confirmation.
$KXS
Strong uptrend, but stretched.
$TCW
Repairing, stretched and carrying limited liquidity.
That adds execution risk to an already incomplete technical setup.
Strong supporting themes do not cancel extension, liquidity or execution risk.
Good theme, bad stock location is still a reason to wait.
No blind chase.
No automatic catch up trades.
📋 Focused Future Leader Radar Watchlist | 30 Stocks
These are the 30 selected candidates from the larger Future Leader Radar universe.
Best Positioned to Catch Up:
$VRSN, $CLOV, $DDOG, $LLY, $VTRS, $WEAV, $JNJ, $UNH, $DVN, $ZIM
Close to Catch Up Confirmation:
BB, EXEL, BIIB, FIG, ABT, PCOR, UTHR, ADMA, ISRG,VRSK, CVS, PAR, VCYT, EW, TCW, ADBE, ZM, OMCL, ADSK, KXS
TradingView copy and paste format:
NASDAQ:VRSN,NASDAQ:CLOV,NASDAQ:DDOG,NYSE:LLY,NASDAQ:VTRS,NYSE:WEAV,NYSE:JNJ,NYSE:UNH,NYSE:DVN,NYSE:ZIM,NYSE:BB,NASDAQ:EXEL,NASDAQ:BIIB,NYSE:FIG,NYSE:ABT,NYSE:PCOR,NASDAQ:UTHR,NASDAQ:ADMA,NASDAQ:ISRG,NASDAQ:VRSK,NYSE:CVS,NYSE:PAR,NASDAQ:VCYT,NYSE:EW,TSX:TCW,NASDAQ:ADBE,NASDAQ:ZM,NASDAQ:OMCL,NASDAQ:ADSK,TSX:KXS
The two Canadian listings use TradingView's $TSX exchange prefix rather than the source workbook's TSE abbreviation.
These are chart review candidates, not automatic buy signals.
The experimental V3.1 shortlist passed its selected-stock data checks. That does not establish superior future returns.
📌 The Verdict
Future Leader Radar narrowed from 192 to 183 screening entries since the last frozen checkpoint.
The largest pools remain concentrated in $IGV, $XLV, $XBI, $XLK, $XLE and $ARKG.
The themes are already showing constructive evidence.
But stock participation remains much less consistent.
The focused shortlist still contains 30 stocks.
However, Best Positioned to Catch Up fell from 17 to 10.
Close to Catch Up Confirmation increased from 12 to 20.
Nine selected charts are stretched, and 17 remain in repair.
The themes are providing evidence. The individual stocks are not yet providing enough consistent confirmation.
That is the current gap.
It does not mean these stocks must eventually catch up.
Some will improve. Others may remain laggards even if their supporting themes continue to lead.
What would upgrade the picture?
• Stronger individual relative strength.
• More sustained participation alongside the supporting theme.
• Cleaner weekly and daily structures.
• Better benchmark confirmation.
• More controlled entry locations.
The stock has to earn promotion through its own behavior.
Next I check support, resistance, extension, available room, liquidity and failure levels.
Only charts that survive manual review move into deeper business research.
The October 27 refresh is anchored to the completed October 26 U.S. market session. One selected listing carries an October 23 last-price date.
The October 14 comparison refers to the last frozen verification checkpoint, not the previous trading day.
Deep dive & support the radar: buymeacoffee.com/tapevector
My market journal, not financial advice.
A strong theme gives me a place to look.
The stock still has to prove it deserves capital.
Price first. Relative strength second. Theme confirmation last.
🤖 Made with AI


TAPE Vector retweeted

🚨 TUESDAY PREMARKET EARNINGS,
BEFORE THE OPEN!🔥
The market’s earnings cheat code this week:
It's no longer just about who BEATS expectations. It's
about who gets punished for weak forward guidance.
☀️ Reporting BEFORE the opening bell:
$SOFI Fintech sentiment
$PYPL Margin scrutiny
$BA Cash burn watch
$UPS Freight & macro demand
$KO Consumer health check
$FCX Copper & global growth
One of these could BEAT expectations and still get
absolutely dumped at the opening bell. 📉
🎯 Which one survives, and which one gets crushed?
Drop your picks before the bell! 👇
🚨 DEVELOPING LEADERSHIP: The next leadership layer is shrinking, and fewer charts are ready for immediate review.
The Developing Leadership universe has contracted from 66 to 33 stocks since the last frozen October 14 checkpoint.
The experimental V3.1 focused chart review list now contains 24 stocks.
• 7 Best Positioned Now
• 8 Close to Confirmation
• 9 Building Strength
Some individual stocks are already acting well. Supporting themes are showing strength.
But the evidence remains uneven.
The next leadership layer is still forming. Fewer stocks are technically ready, and the wider confirmation is incomplete.
The breakdown:
📊 The Developing Leadership Picture
The universe has fallen from 66 to 33 stocks, a 50% contraction compared with the last frozen checkpoint.
Current evidence:
• 26 stocks have aligned supporting theme trends.
• 26 stocks have mixed but positive individual relative strength trends.
• 26 stocks still have incomplete broader stock and theme confirmation.
• All 33 remain under mixed broader market conditions.
This is not a universe of uniformly weak stocks.
Many have useful relative strength, constructive themes and evidence worth investigating.
But having a strong supporting theme is not the same as having complete stock leadership.
Some stocks are outperforming while their benchmark alignment remains mixed.
Others have improving charts but insufficient consistency across relative strength windows.
Theme support is more established than full individual stock confirmation.
The next step toward Front Line Leadership requires stronger alignment across the evidence layers.
A higher stock price alone does not complete that process.
🧭 Where Developing Leadership Is Concentrated
The six largest theme concentrations:
• $IGV: 7 stocks, software
• $XBI: 7 stocks, biotechnology
• $XLK: 5 stocks, technology
• $XLV: 4 stocks, healthcare
• $ARKG: 2 stocks, genomics
• $WCLD: 2 stocks, cloud software
The four largest groups contain 23 of 33 stocks, approximately 70% of the Developing Leadership universe.
Software and biotechnology alone account for 14 candidates.
That is where much of the potential next leadership layer is concentrated.
But the internal evidence differs.
IGV contains several stocks with repairing or mixed technical structures.
XBI contains some strong individual relative strength, while theme confirmation remains less consistent.
XLK and XLV provide additional developing candidates, but broader alignment is still incomplete.
The next leadership layer remains concentrated in a handful of themes, not broadly distributed across the market.
🎯 The Focused Chart Review Funnel
The experimental V3.1 shortlist currently contains 24 stocks.
Compared with the last frozen October 14 checkpoint:
• Focused list: 30 → 24
• Best Positioned Now: 16 → 7
• Close to Confirmation: 11 → 8
• Building Strength: 3 → 9
The share of Best Positioned Now candidates fell from approximately 53% to 29%.
That is a meaningful deterioration in immediate chart review readiness.
Current technical structure:
• 5 strong uptrends
• 3 uptrends
• 7 repairing charts
• 9 mixed trends
Current extension:
• 13 pullbacks
• 8 normal extension conditions
• 3 stretched charts
Liquidity remains relatively constructive:
• 23 high liquidity
• 1 normal liquidity
The main problem is not liquidity.
It is the smaller number of stocks with clean current technical conditions.
There is another important distinction.
This is a comparison between two selected universes at different checkpoints. It does not mean every individual stock deteriorated.
A technically improving chart can also remain Developing Leadership if broader evidence is incomplete.
Fewer clean current setups. More charts still requiring confirmation.
🔎 The Charts I Am Opening First
Biotechnology (XBI): $IOVA
$IOVA has aligned individual relative strength, an uptrend, a pullback and high liquidity.
Its primary relative strength reading is approximately +126.8%.
That is strong individual performance relative to its benchmark.
But supporting theme evidence remains mixed.
Strong stock, incomplete theme confirmation.
I want to see whether the pullback provides a controlled location rather than chasing the relative strength number.
Healthcare (XLV): $MCK
$MCK shows a strong uptrend, normal extension and high liquidity.
But its primary relative strength reading is approximately -4.2%.
That creates an important distinction between absolute chart structure and benchmark outperformance.
A technically strong chart does not automatically mean the stock is outperforming its benchmark over the selected window.
I want that relationship to improve.
Cloud Software (WCLD): $SNOW, $FIVN
$SNOW has an uptrend, a pullback, high liquidity and supportive driver evidence.
$FIVN has an uptrend, normal extension and high liquidity.
Both have constructive supporting theme evidence.
$SNOW still has mixed broader confirmation.
$FIVN shows stronger stock and theme confirmation, but the relative strength trend remains mixed.
Different evidence gaps inside the same broad software area.
Both deserve chart review.
Shipping (BOAT): $DHT
$DHT has a strong uptrend, a pullback and high liquidity.
The supporting theme is aligned, but wider confirmation remains mixed.
The chart is worth opening.
I still need to establish where support holds, what resistance lies ahead and whether the available reward justifies the risk.
Healthcare and Biotechnology (IBB): $GILD
$GILD has a strong uptrend, normal extension and high liquidity.
Its primary relative strength reading is approximately +0.6%.
The technical structure is constructive, but the benchmark advantage is modest.
I want stronger relative strength confirmation before treating it as a more established leader.
Technology (XLK): $3231
The Taiwanese listing shows a strong uptrend, a pullback and high liquidity.
It also has supportive driver evidence.
Individual strength is constructive, but broader confirmation remains incomplete.
This is another example of a potentially usable chart appearing before the full evidence stack is aligned.
⚠️ The Entry Quality Warning
Several focused stocks deserve monitoring rather than aggressive entries.
$WDAY and $GWRE
Both have repairing trends and stretched conditions.
$PR
Strong uptrend, but stretched.
$ABCL, $PSNL and $PANW
All three are still Building Strength, with mixed trend structures and pullback conditions.
They may improve.
But I am not treating developing evidence as confirmed leadership.
Good stock, bad current location is still a reason to wait.
No blind chase.
No automatic entries.
📋 Focused Developing Leadership Watchlist | 24 Stocks
These are the stocks from the larger 33 stock Developing Leadership universe that currently qualify for the experimental focused chart review list.
Best Positioned Now:
$IOVA, $MCK, $SNOW, $FIVN, $3231, $DHT, $GILD
Close to Confirmation:
$GDYN, $WAY, $WDAY, $GKOS, $PATH, $GWRE, $PR, $MDT
Building Strength:
ABCL, PSNL, PANW, NEO, U, NVAX, DUOL, RXRX, IBRX
TradingView copy and paste format:
NASDAQ:IOVA,NYSE:MCK,NYSE:SNOW,NASDAQ:FIVN,TPE:3231,NYSE:DHT,NASDAQ:GILD,NASDAQ:GDYN,NASDAQ:WAY,NASDAQ:WDAY,NYSE:GKOS,NYSE:PATH,NYSE:GWRE,NYSE:PR,NYSE:MDT,NASDAQ:ABCL,NASDAQ:PSNL,NASDAQ:PANW,NASDAQ:NEO,NYSE:U,NASDAQ:NVAX,NASDAQ:DUOL,NASDAQ:RXRX,NASDAQ:IBRX
The exchange-qualified line preserves TradingView's required import format.
These are chart review candidates, not automatic buy signals.
The experimental V3.1 shortlist passed its selected-stock data checks. That does not establish superior future returns.
📌 The Verdict
Developing Leadership contracted from 66 to 33 stocks since the last frozen checkpoint.
The focused review list declined from 30 to 24 stocks.
Best Positioned Now fell from 16 to 7.
Building Strength increased from 3 to 9.
The strongest concentrations remain in $IGV, $XBI, $XLK and $XLV.
But the main challenge is evidence consistency.
The number of developing candidates has fallen. The number of immediately usable chart review candidates has also fallen.
This is not proof that the next leadership cycle has failed.
It means the current evidence is less complete and the chart review queue is less mature than at the previous frozen checkpoint.
What would strengthen the picture?
• More consistent individual relative strength.
• Better benchmark confirmation.
• Stronger stock and theme alignment.
• Broader market participation.
• Cleaner current chart structures.
A better chart alone does not create Front Line Leadership.
The next step is stronger alignment, not simply a higher stock price.
I am now checking weekly and daily structure, support, resistance, available room, extension, liquidity and failure levels.
Only charts that survive that process move into deeper business research.
The October 27 refresh reflects the completed October 26 U.S. market session for the U.S. names. The selected Taiwanese listing carries an October 27 price date, so this is not a simultaneous global closing snapshot.
The October 14 comparison refers to the last frozen verification checkpoint, not the previous trading day.
Deep dive & support the radar: buymeacoffee.com/tapevector
My market journal, not financial advice.
The radar tells me what deserves the next review.
The chart still decides whether the setup is usable.
Price first. Relative strength second. Theme confirmation last.
🤖 Made with AI


