

Lt Col, USAF Retired, Meteorologist (CCM) Book: https://xitter.cf/t.co/uI1lWnbLRM Creator: https://xitter.cf/t.co/OwkNHtscCv Former typhoon forecaster NWS COOP Observer: 1995-2012
Florida
Joined January 2022
- Tweets40.1K
- Following1.2K
- Followers44.4K
- Likes126K





John Shewchuk retweeted

My Climate Explorer application pulls the USHCN data together in a relational database where the estimated data can be removed from the SQL queries.
github.com/wtblock/ClimateSu…

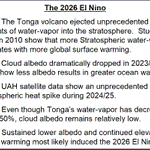
Major changes forecast this winter could well be the continuing sequence of unusual events following the unprecedented Hunga-Tonga volcano. We will all learn together what an unprecedented submarine volcano can do.


EL NIÑO is set to bring a major, significant, and possibly record setting winter of weather to Florida and the Gulf Coast this season.
The impacts probably start being felt regularly in the pattern the last 2 weeks of November.
Euro ensemble mean with a strong signal of suppressed storm track, higher than typical rain totals across Florida and the I-10 corridor. I expect somewhere in Florida to challenge a record for wettest winter on record. Whom that ends up being, no idea. But the table is set for that potential between Nov. 2026 and Mar. 2027.
The window of EL NIÑO impact in the weather pattern likely starts to settle in around a month from now.


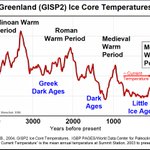
North Atlantic storms were common during the Little Ice Age ... blackthornandstone.com/2020/…


Look at this visible satellite loop of Storm #Austen as it swirls toward England and northwest France!
This storm will produce damaging wind gusts of 60-70+mph, heavy rain, and rough seas.
Josephine was an example of the new NHC storm naming philosophy, as described by the longest serving Director of the NHC, Dr. Neil Frank ... youtube.com/watch?v=30kWv95k…
You'd think that the WMO (of all folks) would understand the basic physics behind global warming. As long as the warming continues, we will continue see new off-charts events. BUT ... these events were most likely greater in the past before modern instrumentation was available.


We're headed for an El Niño that is — quite literally — off the charts.
WMO's Global Seasonal Climate Update shows that El Niño is forecast to exceed the scale of global monitoring charts. Its impacts will be felt well into 2027.
Read the full update: bit.ly/4z2MhwQ
I vote for Jusper as the next UN Secretary General. He uses data versus dogma for see the truth about our climate -- and he knows what's its like to be shunned by the UN climate elite.


PeanutPolitician is doing a really great job with a totally independent look at how NOAA treats USHCN ghost stations and the massive amount of data estimates.

Nonetheless, they are not observations. NOAA's USHCN file still gives 479 of the 1,218 stations a temperature for every month of 2025. The station did not report that year.
The file has a number for it anyway, marked estimated.
That is the sense in which one could call it "false", as in not observed. Not because it moves the national line.
I am not saying the filling-in is done with the goal to deceive.
If the point is to keep that line from jumping when a station goes quiet, then the question I wanted readers to ask is still sitting there: if they didn't report anything, then why are they reporting it? Do you have a good answer?
Even the IPCC (now quietly) admits sea level rise is not a problem.

I downloaded and plotted hourly data for approximately 100 years for many different tide gauges. Every hour is incorporated in these graphs.
The trend is essentially linear for every single one. No cherry-picking.
We are coming out of an ice age. Thus many stations show a few millimeters per year of increasing sea level and some show a few millimeters per year of decreasing sea level because ice is retreating and the continents are uplifting near polar regions.
As far as I can tell there is no sea-level catastrophe and those who say so don't have data to back it up: That is, they are scamming.


Matt blocked me because he prefers to ignore history. Before 2002, the NHC did not assign human names to subtropical storms. Instead, between 1968 and 2001, they were given numbers. Before 1968, they were generally not classified as subtropical at all. More data inflation.

The AP should know that more CO2 is better CO2 - even for corals. CO2 is food for life - on land and in the seas.


The world’s coral reef ecosystems almost all face a high risk of collapse in the next 50 years mostly due to warming oceans and heat waves, according to a global assessment.
Sometimes dubbed “rainforests of the sea,” they have some of the world’s richest biodiversity. apnews.com/article/coral-ree…

More great information about ghost stations and data tampering in general. The evidence keeps mounting.
This is the first map of the ghost stations drawn from NOAA’s current data, and these 479 ghost stations represent 39 percent of NOAA’s network.
This count comes directly from NOAA’s own file dated October 19, 2026. It exceeds the “more than 30 percent” figure Shewchuk gave a reporter in 2024 and is close to the 490 stations flagged on an anonymous map he circulates, which was based on NOAA’s 2022 files.
This map shows the 48 contiguous states, with one dot for each of the 1,218 stations in NOAA’s network. The color and style of each dot indicate what NOAA’s file contains for that station for the year 2025.
•Solid blue dots mark stations that recorded all twelve months of 2025 (547 stations).
•Open circles mark stations that recorded some months of 2025, with the rest estimated by NOAA (192 stations).
•Solid orange dots mark stations for which every month of 2025 is an estimate (479 stations). These are the “ghost stations” that retired meteorologist John Shewchuk has highlighted one by one: stations that no longer report data, yet for which NOAA’s file still carries a full year of temperature values.
The orange dots appear across the country, not concentrated in any single region. They are densest in Oklahoma, Louisiana, the Northeast, and the Pacific Northwest, but every state has at least one. Of the 479, 242 have recorded no actual data since 2014 or earlier, meaning they have been estimated for more than a decade.

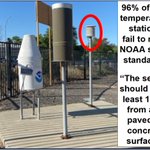
Another great example of a hockey-stick temperature graph - concocted from a combination of ... 1 - altered/fabricated data, 2 - poorly located sensors, and 3 - UHI effects. Michael Mann would be proud.


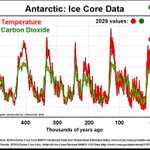
So many still think the Antarctic 138+ sub-glacial volcanoes under the western ice sheets are imaginary -- and CO2 only melts the ice over those volcanoes.

The NSIDC leadership has graph reading problems -- or maybe Obama appointees follow a different path.


NOAA is sponsoring a fake data sale, where all the temperatures produced for ghost stations are completely free.

