

Faith ✝️ Family & Freedom 🇺🇸 ₿itcoin since 2013 | AI nerd | Investor not Trader | Stocks & macro enthusiast Side fun: Invest n' Hold Old username: Brett_ETH
Joined December 2010
- Tweets18.4K
- Following65
- Followers32K
- Likes16.5K







Pinned Tweet
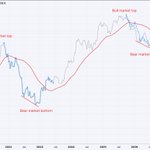
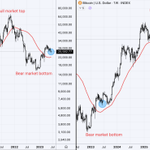
332 days ago, I posted the chart below, showing a Bitcoin peak the week of Oct 6, 2025.
So far, it's been spot on.
Whether that holds as the ATH, we’ll find out.
If BTC starts closing weekly below the 50W MA, odds of the top being in go up.
If the 4-year cycle continues to play out, the buy zone between $55K–$75K will be glorious, just a 40–55% drawdown from the highs. I don't think we see as deep of a bear market, thanks to diminishing returns.
Could we go lower? Sure.
But I’ll be plenty happy filling orders there.
Long-term: Bullish.
Short-term: Respecting the cycle.


#Bitcoin Cycles Timeline. I don't make the rules.
2016-2020
Halving to Peak: 525 days
Peak to Bottom: 364 days
Bottom to Halving 518 days
2020-2024
Halving to Peak: 532 days
Peak to Bottom: 371 days
Bottom to Halving: 532 Days
The next halving date is March 26, 2028. Look how accurately the above timeline would put us at the halving...
Will the pattern continue?


Breaking News: Every single doomsday account on X is calling for a 90 day wipeout. I'm glad all of these random people are giving us the heads up about the world ending. Phew!

This may be my last tweet before shit goes down. I’m an AI researcher whistleblower. I work for one of the biggest labs in the world. There is currently a major cyber attack going on for days attacking US electrical grids. They are hiding this from the public. We are on the verge of a potential disaster that will make Covid look like a playground. Prepare for the worst
Readers added context they thought people might want to know
No reports from CISA, DOE, NERC or major outlets confirm a major ongoing cyber attack on US electrical grids being hidden. Outages are at routine low levels (~30k customers). Real threats exist but not this claimed disaster.
poweroutage.us
cisa.gov

The bears on the feed selling you doomsday info, are the ones who didn't buy in this buy zone I posted back in 2025.
332 days ago, I posted the chart below, showing a Bitcoin peak the week of Oct 6, 2025.
So far, it's been spot on.
Whether that holds as the ATH, we’ll find out.
If BTC starts closing weekly below the 50W MA, odds of the top being in go up.
If the 4-year cycle continues to play out, the buy zone between $55K–$75K will be glorious, just a 40–55% drawdown from the highs. I don't think we see as deep of a bear market, thanks to diminishing returns.
Could we go lower? Sure.
But I’ll be plenty happy filling orders there.
Long-term: Bullish.
Short-term: Respecting the cycle.


When I made this solana:7Lob7rg43kWwmreuxfSTuohun2atBHCXBUkW6KSfpump H&S prediction back in July, I didn't think the right shoulder would look like this.
Regardless, pretty cool to see it bounce the same day I posted it, and come right back to the same line I thought it would, 3 months later.


