

"Let the Chart Speak" #Crypto #Commodity #Equity All my tweets for education & research purpose only Not a Finical Advice
Global
Joined August 2010
- Tweets3.3K
- Following23
- Followers1.7K
- Likes3.3K

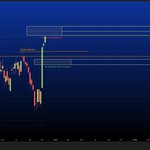


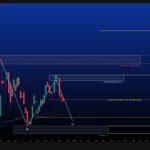


#NiftyBank all time high and moving towards destination - 1 & 2


#Banknifty
🏦 BANK NIFTY | WEEKLY OUTLOOK
Bank Nifty is showing strong bullish momentum after reclaiming the 59,348–61,080 zone.
Key Levels to Watch:
59,348–61,080: Resistance turned Support.
63,064–63,631: Destination 1 for Z-wave.
66,466–67,537: Destination 2 for Z-wave.
53,800–54,000: Immediate downside support.
My View: As long as Bank Nifty sustains above the reclaimed support zone, the next upside targets remain 63,600, followed by 67,500.
Let the structure play out. Don't chase the move!
Chart Seekers — Let the Chart Speak.
Educational analysis only. Not a buy/sell recommendation.

3
236


$DXY — The Z-wave has hit its 1st destination ! 🎯
Now think about this: What if the Z-wave extends further and reaches its next destination? What could that mean for risk assets like bitcoin:native and $GOLD?
As of now, DXY is sitting at a crucial resistance zone. I expect it to spend some time consolidating around this area before we get a potential downside move.
Watch DXY closely. Its next move could set the tone for other asset classes.
Let the chart speak! 📊


$BTC – DAILY OUTLOOK
Bitcoin remains in a sideways phase, with $60,500 acting as a crucial level.
🔻 A daily/weekly close below $60,500 could increase the probability of further downside.
🔺 Sustaining above this zone over the next few weeks could open the door for a recovery towards $75K.
No need to predict. Let the price structure confirm the next move. Waiting for the weekly green candle
Patience over predictions. Let the Chart Speak.
#Bitcoin #BTC #Crypto

8
451


#Banknifty
🏦 BANK NIFTY | WEEKLY OUTLOOK
Bank Nifty is showing strong bullish momentum after reclaiming the 59,348–61,080 zone.
Key Levels to Watch:
59,348–61,080: Resistance turned Support.
63,064–63,631: Destination 1 for Z-wave.
66,466–67,537: Destination 2 for Z-wave.
53,800–54,000: Immediate downside support.
My View: As long as Bank Nifty sustains above the reclaimed support zone, the next upside targets remain 63,600, followed by 67,500.
Let the structure play out. Don't chase the move!
Chart Seekers — Let the Chart Speak.
Educational analysis only. Not a buy/sell recommendation.
ethereum:native
after a sharp Panic dip now its time for a SL Hunting for 15 minutes bull run traders

🚨 ethereum:native — The Marked Level Finally Hit!
ETH has reached the level we were tracking. But I’m still looking for the lower highlighted zone.
Personally, a move into that area would be healthier for the market, allowing the larger wave structure to complete before we look for the next opportunity.
Patience over prediction. Let the waves complete!
— Chart Seekers | Let the Chart Speak
Technical analysis for educational purposes only. DYOR.

4
298
$xag
approaching must close below area

$xag
$silver
Silver (XAG/USD) – Monthly Technical Analysis
Silver has delivered a strong impulsive rally, completing what appears to be a five-wave advance on the monthly timeframe. The recent vertical move reflects aggressive buying momentum, but price is now approaching a major long-term supply zone where historical selling pressure could emerge. Such parabolic advances are often followed by a period of consolidation or a corrective phase before the next sustainable trend develops.
From a wave perspective, the current structure suggests that Wave (5) may be nearing completion. A pullback toward the $58–61 region would be technically healthy, allowing the market to unwind overbought conditions while testing previous breakout levels. Failure to hold this area could extend the correction toward the monthly demand zone around $47, which remains the key support for maintaining the long-term bullish structure.
If buyers successfully defend the demand zone and accumulation resumes, Silver could spend several months trading within a broad range before attempting another breakout. A decisive close above the long-term supply zone would invalidate the corrective outlook and open the path toward the $68 region initially, with the possibility of an extended move toward $120+ over the longer term.
Overall, patience is essential. Chasing price after a near-vertical rally carries elevated risk. The preferred strategy is to wait for confirmation of a corrective pullback into support before positioning for the next major leg higher.


$COPPER
🚨 #COPPER: TIME FOR A MAJOR CORRECTION?
Copper is facing strong resistance in its monthly supply zone (61,800–73,900).
Bearish momentum is building. If 61,000 breaks on a monthly closing basis, we could see downside targets at 53,000, 40,000 and potentially 32,000.
The bulls may be losing control. Is a major crash loading? 📉

1
3
514
$BTC || DAILY OUTLOOK | WEEKLY STRUCTURE
Bitcoin has already witnessed impulsive moves in both directions — a strong rally followed by an equally aggressive Pullback.
Now, the market may be entering a different phase:
SIDEWAYS CONSOLIDATION.
After such aggressive movements, the market needs time to cool down, build liquidity, and establish its next direction.
I'm expecting BTC to move sideways between $61K–$63.4K for some time, with potential swings on both sides before the next major move.
Remember, not every day needs to be a trending day.
Sometimes, the best move is patience.
The market has made its impulsive moves. Now it's time to let it breathe.
Don't force trades in a market that's still deciding its next direction. 🎯

3
607
🚨 ethereum:native — The Marked Level Finally Hit!
ETH has reached the level we were tracking. But I’m still looking for the lower highlighted zone.
Personally, a move into that area would be healthier for the market, allowing the larger wave structure to complete before we look for the next opportunity.
Patience over prediction. Let the waves complete!
— Chart Seekers | Let the Chart Speak
Technical analysis for educational purposes only. DYOR.
bitcoin:native | DAILY OUTLOOK
Finally, BTC has reached the downside zone we had been tracking. 🎯
Now comes the interesting part.
After this sharp decline, panic selling may push investors to exit their positions just to recover whatever they can. But this is where the market could start setting up its next move.
I'm watching for a potential retracement on the 4H / Daily timeframe.
If BTC manages to close a strong green daily candle, it could signal the beginning of a relief rally.
Remember, markets don't always move in the direction everyone expects. Sometimes, they create maximum fear, shake out weak hands and only then prepare for the next major move.
The bigger question: Is this the shakeout before the final run?
Watch the daily closing candle. Confirmation matters more than anticipation.
Chart Seekers -- Let the Chart Speak.
#BTC #Bitcoin #Crypto #TechnicalAnalysis

1
6
593
ethereum:native
A retest of the support zone looks inevitable sooner or later. The real question is: Will we get a meaningful reversal from here?
Personally, I don't think so.
The larger wave structure still suggests further downside. ETH may need to complete its Wave C downside and the broader B-wave correction before a sustainable reversal can take shape.
Don't anticipate a reversal just because price reaches support. Let the wave structure confirm the move.
Read the structure, not the hope.
Chart Seekers — Let the Chart Speak.

3
9
710
Chart Seekers retweeted
bitcoin:native | Daily Market Outlook 📉
Bitcoin is approaching the $63K–$61K support zone, and this is where emotions could take over the market.
Many traders who have already suffered losses may now look for an exit, hoping to avoid further pain. But remember, selling out of fear near an important support zone is not always the smartest decision.
The market has a habit of testing investors' patience. When fear becomes dominant, people often make emotional decisions rather than following their plans.
My perspective: Don't blindly sell just because price is falling. Let the market reach the key zone and watch how price reacts.
$63K–$61K: Important support zone to watch.
$75K: First level to reclaim.
$74K–$76K: Major resistance zone.
If support holds, we could see a meaningful reaction. However, a decisive close below $61K would change the picture.
Remember: The biggest mistake is allowing fear to make your decisions. Sometimes, the level where everyone starts losing confidence is exactly where patience matters the most.
Don't let emotions decide your trades.
-- Chart Seekers -- Let the charts speak. 🎯

Chart Seekers retweeted
📊 ETHEREUM DAILY OUTLOOK | ethereum:native
ETH is trading near $1,903, maintaining a downside selling preasure below the key EMA zone ($2,457–$2,526).
🔴 Key Support: $1,794 → $1,680 → $1,615
🔺 Major Resistance: $2,600–$2,800
⚠️ Losing the support zone could expose ETH to the larger downside demand zone of $1,041–$595.
My View: Until ETH reclaims key EMAs, rallies may face selling pressure. Stay cautious and watch the levels!
#ETH #Ethereum #CryptoAnalysis #TechnicalAnalysis #ChartsSeekers

📊 ETHEREUM DAILY OUTLOOK | ethereum:native
ETH is trading near $1,903, maintaining a downside selling preasure below the key EMA zone ($2,457–$2,526).
🔴 Key Support: $1,794 → $1,680 → $1,615
🔺 Major Resistance: $2,600–$2,800
⚠️ Losing the support zone could expose ETH to the larger downside demand zone of $1,041–$595.
My View: Until ETH reclaims key EMAs, rallies may face selling pressure. Stay cautious and watch the levels!
#ETH #Ethereum #CryptoAnalysis #TechnicalAnalysis #ChartsSeekers
bitcoin:native | Daily Market Outlook 📉
Bitcoin is approaching the $63K–$61K support zone, and this is where emotions could take over the market.
Many traders who have already suffered losses may now look for an exit, hoping to avoid further pain. But remember, selling out of fear near an important support zone is not always the smartest decision.
The market has a habit of testing investors' patience. When fear becomes dominant, people often make emotional decisions rather than following their plans.
My perspective: Don't blindly sell just because price is falling. Let the market reach the key zone and watch how price reacts.
$63K–$61K: Important support zone to watch.
$75K: First level to reclaim.
$74K–$76K: Major resistance zone.
If support holds, we could see a meaningful reaction. However, a decisive close below $61K would change the picture.
Remember: The biggest mistake is allowing fear to make your decisions. Sometimes, the level where everyone starts losing confidence is exactly where patience matters the most.
Don't let emotions decide your trades.
-- Chart Seekers -- Let the charts speak. 🎯
bitcoin:native | Daily Market Outlook 📉
Bitcoin is approaching the $63K–$61K support zone, and this is where emotions could take over the market.
Many traders who have already suffered losses may now look for an exit still holding trade , hoping to avoid further pain. But remember, selling out of fear near an important support zone is not always the smartest decision.
The market has a habit of testing investors' patience. When fear becomes dominant, people often make emotional decisions rather than following their plans.
My perspective: Don't blindly sell just because price is falling. Let the market reach the key zone and watch how price reacts.
$63K–$61K: Important support zone to watch.
$75K: First level to reclaim.
$74K–$76K: Major resistance zone.
If support holds, we could see a meaningful reaction. However, a decisive close below $61K would change the picture.
Remember: The biggest mistake is allowing fear to make your decisions. Sometimes, the level where everyone starts losing confidence is exactly where patience matters the most.
Don't let emotions decide your trades.
-- Chart Seekers -- Let the charts speak. 🎯

Chart Seekers retweeted
bitcoin:native | The Golden Pocket Trap?
Many will once again look for a LONG opportunity around the Golden Pocket / Cute Support , assuming it's a guaranteed support zone.
But the wave structure suggests that further downside may still be ahead.
Blindly longing every dip and averaging down (DCA) without confirmation is NOT a strategy.
Let the wave structure complete first. Patience over prediction.
This is where Wave becomes the Best of Technical Analysis.
If you want to understand market structure rather than blindly follow support and resistance, you need to learn how to read the waves.
-- Chart Seekers -- Let the Chart Speak.
