

"Let the Chart Speak" #Crypto #Commodity #Equity All my tweets for education & research purpose only Not a Finical Advice
Global
Joined August 2010
- Tweets3.3K
- Following23
- Followers1.7K
- Likes3.3K





Chart Seekers retweeted
bitcoin:native | Daily Market Outlook 📉
Bitcoin is approaching the $63K–$61K support zone, and this is where emotions could take over the market.
Many traders who have already suffered losses may now look for an exit, hoping to avoid further pain. But remember, selling out of fear near an important support zone is not always the smartest decision.
The market has a habit of testing investors' patience. When fear becomes dominant, people often make emotional decisions rather than following their plans.
My perspective: Don't blindly sell just because price is falling. Let the market reach the key zone and watch how price reacts.
$63K–$61K: Important support zone to watch.
$75K: First level to reclaim.
$74K–$76K: Major resistance zone.
If support holds, we could see a meaningful reaction. However, a decisive close below $61K would change the picture.
Remember: The biggest mistake is allowing fear to make your decisions. Sometimes, the level where everyone starts losing confidence is exactly where patience matters the most.
Don't let emotions decide your trades.
-- Chart Seekers -- Let the charts speak. 🎯

Chart Seekers retweeted
📊 ETHEREUM DAILY OUTLOOK | ethereum:native
ETH is trading near $1,903, maintaining a downside selling preasure below the key EMA zone ($2,457–$2,526).
🔴 Key Support: $1,794 → $1,680 → $1,615
🔺 Major Resistance: $2,600–$2,800
⚠️ Losing the support zone could expose ETH to the larger downside demand zone of $1,041–$595.
My View: Until ETH reclaims key EMAs, rallies may face selling pressure. Stay cautious and watch the levels!
#ETH #Ethereum #CryptoAnalysis #TechnicalAnalysis #ChartsSeekers

Chart Seekers retweeted
bitcoin:native | The Golden Pocket Trap?
Many will once again look for a LONG opportunity around the Golden Pocket / Cute Support , assuming it's a guaranteed support zone.
But the wave structure suggests that further downside may still be ahead.
Blindly longing every dip and averaging down (DCA) without confirmation is NOT a strategy.
Let the wave structure complete first. Patience over prediction.
This is where Wave becomes the Best of Technical Analysis.
If you want to understand market structure rather than blindly follow support and resistance, you need to learn how to read the waves.
-- Chart Seekers -- Let the Chart Speak.

Chart Seekers retweeted
$BTC | Daily Technical Outlook
Bitcoin is showing a recovery from the $76,417–$77,068 demand zone, but the upside momentum still needs confirmation.
The immediate resistance zone is $80,966–$81,676. A daily candle close above $81,772 is required to confirm further upside momentum.
My preferred view remains cautious. If BTC faces rejection from the resistance zone, another corrective move towards $76,417 is possible. A breakdown below this support could open the door towards the Weekly Support-1 zone of $69,076–$72,575.
Key Levels:
Resistance: $80,966–$81,772
Immediate Support: $76,417–$77,068
Weekly Support-1: $69,076–$72,575
-- Chart Seekers -- Let the Chart Speak.
Technical analysis for educational purposes only. Not financial advice. DYOR.

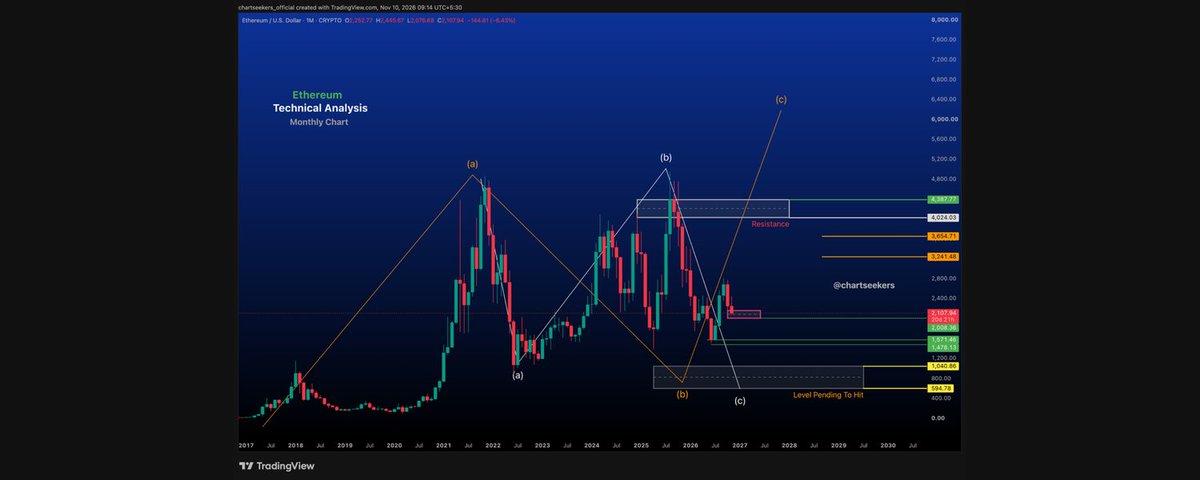
Chart Seekers retweeted
🪔 Wishing the entire Chart Seekers family a very Happy Diwali!
May this festival of lights bring happiness, prosperity, good health, and success to you and your loved ones.
Keep shining, keep learning, and
Let the chart speak! — Team Chart Seekers ❤️
#HappyDiwali #HappyDiwali2026

Chart Seekers retweeted
#Nifty 50 – Daily Technical Outlook | 6 November 2026
Nifty has witnessed a strong recovery from the October lows, showing signs of a potential bullish reversal. The larger wave structure indicates that the A-B corrective phase may be complete, with the next upward C-wave development being monitored.
Key Levels to Watch:
Immediate Hurdle: 24,573–24,795
Support Zone: 24,463–24,229
Major Resistance-2: 25,511–25,728
My View:
Nifty is approaching a crucial hurdle zone. A sustained breakout above 24,795 could strengthen bullish momentum and open the possibility of a move towards 25,511–25,728.
However, rejection from the hurdle may lead to a short-term retracement before the next upside attempt.
The broader wave structure remains constructive, but confirmation through price action is essential.
Let the Chart Speak. 📊
#Nifty50 #TechnicalAnalysis #ChartSeekers

Chart Seekers retweeted
$CRCL
Get your self ready for all time low if we break the support


$CRCL
Market Structure & Wave Pattern: The chart outlines an ABC corrective/impulsive pattern. Wave (A) completed a previous bounce and reach around $136 - $139, while Wave (B) is forming near the lower key support area.
Decision Area & Key Support: Price is currently hovering around a Decision Area / Support-1 region near $68.00 to $60.00.
Bullish Scenario: If price holds above the primary support zone and breaks key overhead resistance, it sets up a long-term Wave (C) rally targeting $174.00+.
Bearish / Downside Risk: A breakdown below the red horizontal key level ("Must Break This for the downside") invalidates the immediate bullish structure and retest the support -1 even this would trigger a drop toward lower highlighted in orange ("Pending To Hit if the support Break") around the $40.00–$35.00 zone.
This is a technical analysis NFA and DYOR

Chart Seekers retweeted
📊 bitcoin:native | Daily Technical Outlook
Bitcoin is struggling to reclaim the immediate resistance zone of $76,417–$77,563.
The daily chart suggests that the WXYXZ corrective structure may still have room for a final downside extension, with the Z-wave potentially approaching completion.
Key Levels to Watch:
🔴 Resistance: $76,417 – $77,563
🟢 Weekly Support Zone: $69,076 – $72,575
My View:
A rejection from the resistance zone could extend the downside towards weekly support.
A sustained daily close above $79,563 would be the first sign of improving momentum.
I am watching the $69K–$72.5K zone closely for a potential reaction and confirmation of the next move.
For now, patience is key. I would prefer confirmation over anticipating a reversal.
Let the Chart Speak. 📉
Disclaimer: This is a personal technical-analysis view for educational purposes only, not financial advice or a buy/sell recommendation. Always DYOR and manage risk.

Chart Seekers retweeted
$oil | $WTI | base:0xa4d5501deaa04807bd5c48e3f2bf3fd9b79a4ba3 | $usoil
'Z' wave started must close below the market level in red for the downside

$OIL | $CRUDE | $WTI
Little change in the weekly supply zone. The downside Z-wave appears to have started. Bearish momentum may continue if the weekly candle closes red, accompanied by relatively low volume.
Weekly closing will be key to confirming the continuation of the downside move.
— Chart Seekers | Let the Chart Speak.

Chart Seekers retweeted

Someone is impersonating me on telegram. I request all of you to report the below 2 accounts. They are running a scam on my name. I will never run such schemes. Stay alert from such scammers.
t.me/opinderpreet
t.me/opinderpreet_CutDNoise

Chart Seekers retweeted
🚀 #NIFTY 50 | WEEKLY OUTLOOK
Bulls Are Back in Action! 📈
Nifty has delivered a strong bullish candle, gaining 2.01% to close at 25,030.
The big development? The previous resistance zone of 24,229–24,463 has now turned into support.
🎯 C-Wave Upside Targets:
25,511
25,690
25,903
What to Watch Next?
Holding above the 24,229–24,463 zone could keep the bullish momentum alive. A sustained move above 25,030 may open the door towards the next resistance levels.
The structure looks promising, but let the price confirm the next move!
Read the Structure. Understand the Market.
⚠️ Risk Disclaimer: For educational purposes only, not investment advice. Trading involves risk; always do your own research.
#Nifty50 #StockMarket #TechnicalAnalysis #ChartSeekers


Chart Seekers retweeted
$OIL | $CRUDE | $WTI
Little change in the weekly supply zone. The downside Z-wave appears to have started. Bearish momentum may continue if the weekly candle closes red, accompanied by relatively low volume.
Weekly closing will be key to confirming the continuation of the downside move.
— Chart Seekers | Let the Chart Speak.
#NIFTY50 & $OIL — TWO CHARTS, ONE BIG STORY! 📊
Both charts are showing interesting Wave structures, and their potential correlation is worth watching closely.
🇮🇳 NIFTY 50 — Weekly Outlook
CMP: 23,053
Support zone: 22,343–21,881
Extended downside possibility: 21,169–20,923
If the corrective structure completes, Wave (C) could potentially target 28,049–28,544.
🛢️ CRUDE OIL — Weekly Outlook
CMP: 101.95
Weekly supply zone: Around 105.49
Major monthly supply: 111.41–117.95
Potential downside support: 67.29–62.13


Chart Seekers retweeted
$CRCL
z wave is about to complete and reaching the demand zone if break then create all time low also

$CRCL
Market Structure & Wave Pattern: The chart outlines an ABC corrective/impulsive pattern. Wave (A) completed a previous bounce and reach around $136 - $139, while Wave (B) is forming near the lower key support area.
Decision Area & Key Support: Price is currently hovering around a Decision Area / Support-1 region near $68.00 to $60.00.
Bullish Scenario: If price holds above the primary support zone and breaks key overhead resistance, it sets up a long-term Wave (C) rally targeting $174.00+.
Bearish / Downside Risk: A breakdown below the red horizontal key level ("Must Break This for the downside") invalidates the immediate bullish structure and retest the support -1 even this would trigger a drop toward lower highlighted in orange ("Pending To Hit if the support Break") around the $40.00–$35.00 zone.
This is a technical analysis NFA and DYOR
Chart Seekers retweeted
$BTC DAILY OUTLOOK 📊
Bitcoin is currently trading around $77,300
at the key daily level. However, buying volume can be seen during the recent daily red candle, which is an encouraging sign.
From a wave perspective, the WXYXZ corrective structure on the daily timeframe appears to be completed. Still, an extension toward Weekly Support-1 cannot be ruled out.
Personally, I’m waiting for a weekly green candle and weekly closing confirmation before expecting stronger upside momentum.
📌 The daily structure looks interesting, but the weekly close will provide the final confirmation.
Read the Structure. Understand the Market.
⚠️ Technical analysis only. Not financial advice. DYOR.

$BTC | Daily Timeframe ⚠️
No clear sign of buying strength on the daily chart yet.
If BTC fails to close today’s daily candle in green, a retest of Support-2 remains on the table.
Patience is key. Let the daily candle confirm the move before expecting a recovery.
Chart Seekers — Let the Chart Speak. 📊

Chart Seekers retweeted
#NIFTY50 & $OIL — TWO CHARTS, ONE BIG STORY! 📊
Both charts are showing interesting Wave structures, and their potential correlation is worth watching closely.
🇮🇳 NIFTY 50 — Weekly Outlook
CMP: 23,053
Support zone: 22,343–21,881
Extended downside possibility: 21,169–20,923
If the corrective structure completes, Wave (C) could potentially target 28,049–28,544.
🛢️ CRUDE OIL — Weekly Outlook
CMP: 101.95
Weekly supply zone: Around 105.49
Major monthly supply: 111.41–117.95
Potential downside support: 67.29–62.13
Chart Seekers retweeted
$XAG
$SILVER
Silver (XAG/USD) — Weekly / Monthly Outlook
Silver is at a crucial level after a sharp rally and strong rejection from the higher supply zone.
🔻 Weekly Outlook: A decisive weekly close below 47.10 could confirm further downside toward 39.22.
📉 Monthly Outlook: If selling pressure continues, Silver may move into the Monthly Demand Zone between 39.22 and 30.11.
🔑 Key Resistance: 61.33 → 121.11
🔑 Key Support: 39.22 → 30.11
Technical analysis for educational purposes only. DYOR.
Chart Seekers — Let the Chart Speak.
#Silver #XAGUSD

Chart Seekers retweeted
$xau
$gold – Weekly Technical Outlook 📊
Gold is showing signs of a deeper correction after facing strong rejection from the $5,370–$5,597 supply zone.
My primary downside area remains the $3,600–$3,133 weekly/monthly demand zone, where I will be watching for a potential bullish reaction.
I'm bearish on Gold's since Jan -2026. I'm simply waiting for a healthier structure before the next major move.
Patience is key. Let the price come to your levels.
-- Chart Seekers -- Let The Chart Speak
#GOLD #XAUUSD
