

Market Technician. Active Trader. Passionate about Investor Education. Part-time 🏀 coach. Father to FOUR boys. Co-founder of @MarketScholars 👨💻🎙️📈💰👨🎓
USA
Joined October 2010
- Tweets28.4K
- Following7.1K
- Followers19.5K
- Likes81.9K




Pinned Tweet
I’m out of town today and tomorrow taking in the great Fall sights in the Utah mountains so there’s no new Market Outlook, Market Outlook Live, or Free Friday video this week.
I’ll be back Monday, October 19.
Go Cougs! Beat the Irish 🏈

Tonight's #MarketOutlook is at @MarketScholars. Link in reply 👇
Discussed: $DELL's downgrade met hot core CPI. $SMH fell 3.98% despite lower closing yields.
Which of tonight's five Preview charts best explains the damage?

This is an important level for $QQQ. There are a LOT of touches here and not much volume below until it reaches $630. Considering the "fakeout" above $750 a couple of weeks ago, this is a little more vulnerable than the prior break in July.

The "selloff" at 1.99% off ATHs $SPX


Tom Lee: "I think we're near the end stages of the selloff" @fundstrat @fundstratdirect
Ed @Yardeni: "As long as the economy is growing, we've got a bull market. And this is just another scare along the way." @CNBC


On Sep 30, $SPX was down 1.96% from its all-time closing high. Only 21.08% of its stocks were ABOVE their 50-day SMAs and only 39.56% of its stocks were ABOVE their 200-day SMAs.
Today, $SPX is down 1.93% from its all-time closing high. Nearly identical. But...
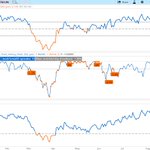
Now, 56.14% of its stocks are above their 50-day SMAs and 56.75% of its stocks are above their 200-day SMAs - bringing the ratio of the 2 averages down to nearly 1.
Normally, as you can see on the chart, this is a CRAZY bullish pattern. UNLESS....
We get the same thing that happened in early 2025 as I've mentioned here multiple times before.


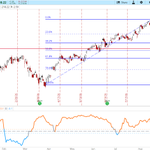
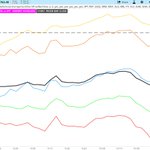
The gap between the 8-day and 17-day EMAs and 30-day SMA is literally its smallest in 3 months. This typically precedes an expansion as the PPO in the lower panel is flirting with a breakout to new momentum. $SPX

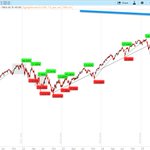
The last 4 "bull tags" on $SPX set the low point for S&P 500 but they ALSO happened to start both of the past 2 very weak intermediate declines.
With $RUT already well into a deep intermediate pullback and $NDX also now in its own confirmed intermediate pullback, does that mean we're just getting started now on $SPX?
Or, are we setting the low for a 5th straight time?


Coming off a divergent high no less no matter what indicator you're looking at - RSI, CCI, DMI or PPO $XLK
With one more day left in the week, $XLK is breaking its 17-week EMA for the 1st time since the deep pullback we experienced earlier this year and, before that, the 2025 Q1 correction and, before that, the deep pullbacks of 2023 and 2024 and, before that, the 2022 correction 👀

With one more day left in the week, $XLK is breaking its 17-week EMA for the 1st time since the deep pullback we experienced earlier this year and, before that, the 2025 Q1 correction and, before that, the deep pullbacks of 2023 and 2024 and, before that, the 2022 correction 👀
It seems like we're getting a major shift OUT of $XLK and $SMH (1st chart - h/t @RRGresearch at @StockCharts). That CAN be a good thing until you see our Sector Correlations Dashboard at @MarketScholars and realize that the ratio charts of all these sectors with $SPY are all NEGATIVELY correlated with $SPX (2nd chart)


Keep in mind, as great as this move in $RSP has been recently relative to $SPX, it's coming from a deeply oversold position. Our Risk Appetite Dashboard at @MarketScholars still shows mostly Risk Off conditions


