

FREE Weekly Newsletter One chart. One story. One market lesson. 👉 https://xitter.cf/t.co/gabWNkUIgL The content in these posts is educational only.
Australia Melbourne
Joined September 2011
- Tweets6.1K
- Following608
- Followers41.8K
- Likes8K


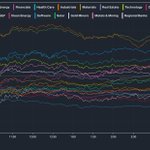

Well, this is getting interesting.
$SMH, $IWM, mid caps and transports are all sitting around their 200-day moving averages.
That's quite a few important parts of the market testing the same long-term trend indicator at once.
Paul Tudor Jones once said, “My metric for everything I look at is the 200-day moving average of closing prices.”
I'm particularly interested in whether $IWM can reclaim its 200DMA here.

Current stock market rotation and flows into BTC look interesting as well. source: farside and koyfin.


Probably no surprise where all the volume went.

Investors put a net $17.4bn into ETFs in the week to Oct 23, 2026, across the 2,261 funds we track daily.
Check out the full flows report at link below:
👆 $SOXX took in the most, $5.4bn;
👇 $IWM lost the most, $2.4bn.
etfiq.com/flows/weekly/2026-…
#ETFs #ETFFlows


Well, this is quite the turnaround.
South Korea is up almost 5%, with semiconductors doing much of the heavy lifting.
What's interesting is where the bounce started. Price reacted almost exactly where our cross-market analysis had highlighted an important area.
Funny how often these relationships become interesting when everyone is focused on the headlines.
Now let's see if the recovery has some staying power.

fxevolution retweeted

Meta plans $95bn stock offering to bankroll AI expansion w/Chipmakers Nvidia, AMD and Broadcom will act as cornerstone investors. ft.com/content/94e5a0ae-874d…

fxevolution retweeted

Well, there we have it. 1989 is officially the most correlated year-to-date price path for both the S&P 500 and Nasdaq Composite in 2026.

ALT Two-panel chart comparing the 2026 year-to-date performance of the S&P 500 and Nasdaq Composite with their 1989 historical price paths, extended through 1990. The S&P 500 shows a correlation of 0.910, while the Nasdaq Composite shows 0.878. Black lines represent 2026 performance, while blue and red lines represent the respective historical paths. Both charts highlight trading day 204, where 2026 data ends, and the subsequent historical performance through 1990.
fxevolution retweeted

$BUG - Largest trade since inception with price hovering near ATH. Three in the top-20 all bunched together here.
Price is fairly extended on the daily chart. Approaching +3 ATR. Several previous visits to this zone resulted in pullbacks.
Trades of this size at this juncture suggest long positions are being closed out.
Top holdings include $CRWD, $OKTA, $PANW.
volumeleaders.com/register


Monday Stock Market Live: Are Markets Going To Find Support Soon? SP500, Nasdaq, Semiconductors. xitter.cf/i/broadcasts/1qxvvejnm…

I feel like the markets are taking notice, it's just always funny how long it takes retail to realise. Thanks Jason and have a great weekend mate.
We’re heading to MyMoney Expo Sydney! 📈
FX Evolution is excited to be joining MyMoney Expo at ICC Sydney on 28–29 November.
From shares and trading to financial education and wealth creation, we’re looking forward to connecting with investors and the wider finance community.
Come and meet us - General Admission is FREE.
Register: bit.ly/4Bpv95I
#MyMoneyExpo #FXEvolution #Investing #Trading
The Bonds Market Is Starting to Freak Out.
Semiconductor stocks are barely holding onto the Leopold level and 200DMA.
And a new number 1 transaction.
That and more in today's special weekend edition: 👇👇👇
fxevolution retweeted
$PSI - Trades 2, 3, 4, and 5 each arrived at a critical pivot. #1 arrived today. If the pattern continues, we should see a bounce in semis in the near future.
Implications for $SOXX, $SMH, $SOXL, $SOXS
HOWEVER **
Complicating matters is that the Leopold Liquidation Zone in $SMH ($541-$549) finally breached after numerous tests leaving price below a very large zone of concentrated institutional activity. In simpler terms, price is below local support.
Now $PSI is much more evenly balanced among its holdings, with $NVDA only comprising about 4% of the fund whereas $SMH is about 19% $NVDA. So they two ETFs can diverge to some degree depending on how $NVDA performs.
$117.88 is the level to watch for bias on $PSI for the next few sessions. Longs unsafe below it.
volumeleaders.com/register


Plus the CSI was way outside of it's bollinger 😁. 11 straight weeks down did also make some new history. The question now DCB or something real?
