Sr. Research Scientist @autodesk | data visualization, authoring tools | @dataillustrator & dataanimator | prev. @MSFTResearch, PhD @GeorgiaTech w @johntstasko
Atlanta, GA
Joined September 2015
- Tweets275
- Following731
- Followers443
- Likes5K
Applications are now open for 2027 internships in the Future AI Experiences and HCI & Visualization research groups at Autodesk Research!
Full posting to apply here: tinyurl.com/adsk-hci-phd-res…
We’re looking for PhD students excited about research in: HCI+AI, interfaces for generative AI, 3D interaction and authoring, generative interfaces, agentic workflows/interactions, multimodal authoring tools, creativity support, data visualization, novel interaction techniques.
Internships are typically 3-4 months and based in Toronto or San Francisco. While most start in May, we’re flexible with start dates.
During the internship you'll work closely with one or more of us. See our HCI research area page to learn about our team: tinyurl.com/adsk-hci
John Thompson retweeted
Applications are now open for 2026 internships in the HCI & Visualization team at Autodesk Research!
autodesk.wd1.myworkdayjobs.c…
That’s a wrap on @ieeevis week!! 🎥👋
Thanks to everyone who helped make the virtual conference happen in less than a week! Truly an amazing team of volunteers! 🎉🎉🎉
Now time to relax w these 2 cuties ☺️
It has been a remarkably busy/stressful @ieeevis week as Tech Chair.
Finding my zen moment watching @AlbertoCairo present the VISAP Keynote 🍿 It's a great talk and Alberto's a captivating presenter 🎉
I love this UI for working with animations, so cool!
We're super delighted to present and demo TimeTunnel at #CHI2024 - an animation editing interface for character motion in VR, led by @qianzhou_ and done with @f_rasera and George Fitzmaurice. Watch the presentation at 4:30 pm today in room 323C. Check out our demo as well!
John Thompson retweeted
Introducing Realtime: continuous, automated analysis of public data
realtime.org/about
This week I start a new job at @autodesk! I'm joining the HCI+VIS research team as a postdoctoral researcher. I'm excited to prototype for the design community and learn/collaborate with my new, (very) talented colleagues😃
The PacificVis ‘24 Visual Data Storytelling Contest calls for submissions! Showcase your visualization and data storytelling work (e.g., webpage, notebook, infographic, video). Please find more information here: visstory.github.io/
If you’re a datavis author, please take the time to engage in a11y research:
hey #dataviz community! we're conducting a survey to study the challenges that #viz creators face with making online data visualizations accessible to screen-reader users. please consider filling out this survey:
tinyurl.com/a11y-challenges-…
#a11y
John Thompson retweeted
From treatment variables to visual variables. Add visualizations into your causal inference analysis notebooks with Causalvis dl.acm.org/doi/10.1145/35445… @graceguo43 @BCKwon @ehudkar @GT_Vis #CHI2023
I'm thrilled to present Chart Reader at #CHI2023 tomorrow!
jrthomp.com/chart-reader/
Chart Reader is a prototype accessibility engine that renders accessible charts. Iteratively, co-designed w/ our fantastic colleagues at MSFT.
@JesseDoesHCI @yelperalp @edcutrell @bongshin
Come see our #CHI2023 talk, where we demo Chart Reader and chronicle the co-design study.
Wednesday (4/26) @ 9:28am local. Room Y05+Y06.
project: jrthomp.com/chart-reader/
open-sourced code: github.com/microsoft/chart-r…
paper doi: dl.acm.org/doi/10.1145/35445…
examples: jrthomp.com/chart-reader/exa…
I’m really excited to be at #CHI2023 in Hamburg! Looking forward to a week of attending fantastic talks, (re)connecting with folks, and of course enjoying German beer 🍻
Have a great visual data story to showcase? Submit your story to the IEEE Pacific Vis '23 storytelling contest. Submissions due Feb 2 (Thu) - details here: visstory.github.io/
Pretty, pretty good researcher, great golfer, and even better guy! Congrats @johntstasko
Our @johntstasko has been named a @TheOfficialACM Fellow for contributions to the design, analysis, usage, and evaluation of software and information visualization. Congratulations John!
My favorite project to date. Can confirm, very excited to share w/ folks!
Our #chi2023 submission got conditionally accepted! We brought together ARIA, DOM layout, summarization, and sonification techniques to synthesize visualizations that can be explored by screen-reader users.
suuuuuper cool stuff and everyone is excited to share this out soon!
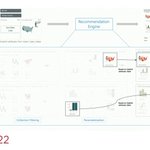
👌Enjoyed the presentation by @10_arjun on intent-based dashboard recommendation at #ieeevis. Congrats on the honorable mention!!👊🏅

ALT Screenshot of presentation from VIS 2022 conference. On the right, larger is a presentation slide showing the recommendation engine of Medeley system. The flow diagram shows the progression of recommendations from collection filtering to parameterization to ranking. The diagram highlights how a bar chart and cartogram map are selected from parameterization stage to ranking stage. On the left, smaller is a presenter view of Arjun Srinivasan.
But can't believe the typical football/movie data got replaced by sales #corporate 😜