

Creator of https://teapawt.org/t.co/Ew3w5pymQl Financial markets & historical analysis Electrical engineer for data centers
Joined April 2023
- Tweets2.9K
- Following160
- Followers2.8K
- Likes22.3K


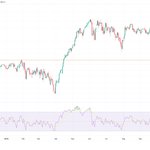


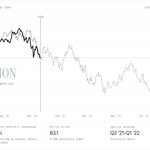


@TrailsideTrades as promised my short term view has changed based on the latest information. Long term thesis unchanged
106
Lucas retweeted

What happens after the VIX closes above 37?
Since 2010, the Nasdaq-100 was higher 3, 6, 9 and 12 months later in all 19 cases.
Average returns:
• 3M: +12.1%
• 6M: +24.8%
• 12M: +33.7%
First close above 37 per episode. Small sample, overlapping periods, not a guarantee.
(NDX and SPX 2000 and 2010 in comments)

Lucas retweeted

Bulls to Bears on Christmas Eve.

A losing streak like this one on $SPX has a very short guest list since 2003.
The financial crisis is on it. The 2018 Christmas Eve selloff is on it. The first week of COVID is on it.
As of this morning, so is this week.
The terminal pulled every one of them. Which do you think this resembles?

6\ Sentiment and valuations
One can't help but notice that sentiment has been very washed out. Valuations currently sit at their lowest point since the Covid crash.
Extreme fear readings across the board with some of the longest period since the past extreme fear print.
Hedge funds coming off the biggest 6 week selling spree ever, put to call ratio spiked over 1...
If there ever was a time to be a contrarian investor this would be it.


1
4
262
Lucas retweeted
#Gold $GLD update.
Not much has changed since the initial outlook on March 18th... Was neutral/bearish then and has paid off.
The truth is it was an obvious blow-off top analogous to every previous one and the downwards consolidation is still the base case for the near future.


Where could we be in the #GLD cycle? Looking back at Gold's last year of parabolic uptrend, what usually follows is a year of consolidation right below the ATH.
If we isolate to the highest score analog found by the model (2006 - post dotcom crash), we can see how the price action was pretty flat over the coming months.
This could be positive for risk assets as these consolidation periods usually lead to upside for equities and crypto. Keeping an eye on Gold


Not really an opinion post, but rather a call for more experienced traders to weigh in on this. I am seeing a lot of discussion on rate hikes as a major headwind for equities.
Yet when looking at 1997, which for #NDX $QQQ is a highly accurate analog in terms of price, I look at the Fed Funds rate which had just been cut for a few times before pausing, and then a singular hike at the moment where the analog matches to today.
The Fed paused at that stage (which also goes against the narrative I see that rate hikes always come in series and never a single one), then cut, but then hiked significantly going right into the peak of the dotcom bubble. So the index did a 4x into a higher rate environment than in 1997.
Again, I don't even believe we are in bubble territory yet, as valuations are very low compared to that period. I am not making any claims, but I do wonder if the fuss about rate hikes, positioning undwinding, and macro uncertainty is a bit overblown?


I would say looking at this chart that they rates were mostly up during the late 90s and the most raging part of the bull market, which is why I found the comparison interesting… See also the one hike at the arrow, which lead to a pause and more cuts not an immediate full hike cycle… Again, I am speaking from my inexperience but I observe this chart and it doesn’t look all that different, and it doesn’t look like rising rates stopped the bull market in its later stages. Glad to hear your take on this

2
14
1,339
Lucas retweeted

The reason you don’t beat the indices is that you’re scared shitless when Nasdaq volatility ($VXN) hits 40 or the $VIX hits 35, precisely when you should be buying aggressively.
Instead, you’re afraid to buy $NVDA at $160 and dump your tech stocks after they’ve already fallen 50%.
That’s where real contrarian investing comes from. Buying when everyone else is terrified. That’s how you beat the indices.
Just remember, all the stories about the future are theories. Most will never materialize. Your fears are just fears, not facts.
I can almost guarantee that a few years from now, you’ll look back at $NVDA trading at $160 and say, “It was so obvious.”
Not in one month, four months, or six months. I’m talking about a few years.
The market rewards those who can think in years while everyone else is panicking about the next few weeks.
Lucas retweeted
I wasn't around in the 90s, but it sure seems like #NDX $QQQ had a lot of similar 8 month periods to the one we're having today with aggressive rallies off the lows, chop, technical correction, before making new highs.
Fed fund rates were also higher in 2000 than they were in 1992, but the index was also 1500% higher...


Bearish KOSPI since July
Hard to be bullish on $KOSPI $EWY at this point.
Here are the last 5 times the index went up like it has in the past year. All instances were lower in the coming weeks. 3/5 had a second leg after some consolidation.
In any case it is likely US equities steal the show again.

4
537