Fundador MORLAN & DataLabMx @MxDatalab. Física PhD SNI I |Esp. Economía Monetaria & Financiera |Economatría |Inf Geoespacial #DataScientist
- Tweets22.1K
- Following5.5K
- Followers1.8K
- Likes32.2K






ALT A chart comparing real-life European art thefts over the past century with film depictions of art theft. Vincent van Gogh is the most targeted artist in reality, while Rembrandt is the most targeted in film. Published by The European Correspondent.

ALT A chart compares Fox News' WNBA player coverage with coverage from other news outlets. Fox News' coverage is distinguished by phrases such as "social media," "white privilege," "national anthem," and "biological men,” whereas other outlets focus on game-related topics. Published by The Pudding.

ALT A chart visualizing polling misses in key Senate races from the 2026 midterm elections. Although pre-election polls correctly identified the winning party, Democratic margins were underestimated by an average of 5 percentage points. Published by The New York Times.

ALT A chart illustrating the function of the Atlantic Meridional Overturning Circulation (AMOC) in climate regulation. The current brings warm water from the tropics to Europe, helping keep the region’s winter significantly milder. Published by Die Zeit.


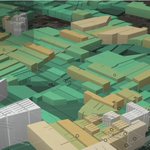
ALT Lámina titulada «Dónde se calienta el suelo y dónde hay árboles», con dos mapas de la Cali urbana del mismo tamaño, lado a lado, con norte, escala en kilómetros y las 22 comunas numeradas. A la izquierda, la temperatura de la superficie frente a la mediana urbana, de 2019 a 2026, de azul (6 °C más fresco) a rojo oscuro (6 °C más caliente): el rojo ocupa el centro, el norte y el oriente, y el azul la ladera del occidente y el sur, sobre todo la comuna 22. A la derecha, la parte de cada hectárea bajo copas de árbol de 3 metros o más, de 2016 a 2019, de crema (casi nada) a verde oscuro (la mitad o más): el verde oscuro está en la ladera del occidente y en el sur, y el centro y el oriente van en crema. Fuentes: Landsat 8 y 9 del USGS y el mapa de altura de la vegetación CHMv2 de Meta y el World Resources Institute. Nota: la lámina no afirma relación ni calcula correlación; solo pone los dos mapas con la misma ventana.


ALT Mapa titulado «Una región partida en dos», 2016-2019, con el norte arriba y escala en kilómetros. Muestra qué parte del suelo está cubierta por árboles de 5 metros o más en Cali y sus vecinos, en cuadros de 100 metros, de casi nada (crema) a casi todo (verde oscuro); en gris, donde había nube. El verde oscuro llena el occidente: Buenaventura, Dagua y la ladera de Cali y Jamundí. El oriente, con Palmira, Candelaria y Puerto Tejada, es casi todo crema, con líneas verdes delgadas a lo largo de los ríos. Cifra destacada: 40 km separan la selva del Pacífico, donde 99 de cada 100 metros están bajo árboles, del valle del río Cauca, donde son 7. Abajo, un corte de oeste a este a la altura de Cali, en kilómetros desde el borde occidental: 99 % en la selva del Pacífico, 67 % al entrar a Cali, 35 % donde empieza la ciudad y 7 % al llegar al río Cauca. Se hizo con el mapa CHMv2 de Meta y el World Resources Institute sobre 5.276 kilómetros cuadrados.