

Publication quality weather maps in seconds. Pyre is a Climatology Reanalysis mapping site using CORe data. Help us get better with feedback!
Pittsburgh, PA
Joined October 2026
- Tweets159
- Following241
- Followers80
- Likes273





Sun dogs / Moon dogs are a good travel omen!
brilliant photos of them shared by James Span

Look up tonight! If you see bright spots on either side of the moon, you’re looking at moon dogs.
They’re the nighttime version of sun dogs. Same idea: thin, high cirrus clouds made of tiny six-sided ice crystals. Moonlight bends as it passes through those flat, plate-shaped crystals, and piles up into bright spots 22 degrees on either side of the moon, at the same height as the moon.
They’re fainter than sun dogs because moonlight is so much dimmer than sunlight — but with the moon still nearly full after last night’s Hunter’s Moon, and thin cirrus overhead, they’re showing up nicely tonight, some with a little color on the edge.
Same sky, same physics, just moonlight doing the work. Beautiful stuff — step outside and take a look!


PyRe Weather retweeted

This is unreal to me. 1) Implications of a cold early winter in Europe: next to no one cares, with NG filled to less than capacity. 2) Correlation of a strong El Niño in December and Europe showing the opposite. So why does no one care? But post something that has nothing to do with what I am trying to show people most of the time with weather and climate examples, and boom, most likes and views ever. How the heck is that even possible? The other 2 are much more important for early winter implications. And I am mad because I will show stuff and then have to go back and ask Grok when I showed it, when people are asking me questions about what I have already shown. And now I have proof of why. it will censor stuff about weather and climate ( that Euro Gas is very important given the neg AO that is trying to set up, but somehow copying something from my buddy with a lot of non-weather, but political points gets it to show it to everyone


Can you break our charting tool? We need feature testers! While working on new visualizations, we don't want release them until the interface is tested and the mathy stuff is correct. if you'd like to be tester, please check the first comment!

We'd love to have you, but first please send this account or @SteelCityCoach a DM so we know you're not a bot.
Join the server here:
discord.gg/dQQ4yna5m
If you're already a follower of either account we'll get you added right away
(DM if expired)
PyRe Weather retweeted

TORNADOES IN ALABAMA: A total of 472 people have died in Alabama from tornadoes since 1978, the year I started doing weather professionally here. This number is unacceptable to me, and it should be to you as well. Too many people have lost their life on my watch.
Over half of those deaths came on one day, April 27, 2011, when 252 people were killed by 62 tornadoes.
The new tornado season for 26-27 is now less than one week away. It runs in Alabama from November through May. I get the idea this season won't be as quiet as the last one. We need to work on preparation now.
Why do people die from tornadoes in Alabama when there are good warnings?
*The siren mentality. Some people honestly believe they will hear a siren in their home, business, or car before a tornado. This is nonsense. Sirens reach a limited number of people outdoors, and that is it. You might hear a siren in your home when they are tested on a sunny day, but what about the middle of the night in a raging storm while you are asleep? No way.
*A high number of false alarms. To this day we have a real problem with a very high false alarm ratio with some NWS offices. Kevin Laws (Science/Operations Officer) with the NWS Birmingham and I did a presentation on this huge problem at the National Weather Association annual meeting in Omaha this past week. I am sure we hurt someone's feelings, but we really don't care.
You don’t run your life or your professional performance based on your feelings, but on the commitments you make to the people you serve.
This is a major issue that is resulting in loss of life. I know the people of this state better than anyone, and they tell me they are tired of false alarms. Warning fatigue is real.
We can't control the nonsense people see on TikTok, but we can control what we produce in the professional weather enterprise.
Warning after warning after warning and nothing happens. It is crying wolf. NWS Birmingham has lowered their FAR (False Alarm Ratio) from around 83% in 2011 to near 30% today. We need this to happen nationally.
And, large traditional broadcast groups need to stop the "Code Red, First Alarm, Weather Emergency Days" for some fog or light rain.
*Short lead times and lack of shelter for those in mobile homes. Trailers offer good, affordable housing for families. But you can't stay there during a tornado. We have to provide longer lead times, and they need a place to go. And, they also need transportation. This is a complex social/physical science issue, but we all need to work together to improve this situation.
So, here is your homework.
*Every home and business needs a NOAA Weather Radio. This is the baseline for receiving warnings. If you won't have one, get one. Most people get the Midland WR-120 that is sold by major retailers.
Your fancy phone becomes a brick when cell service goes away during a tornado emergency. NOAA Weather Radio does not rely on cell service; it is independent RF network that is very, very reliable.
*Be sure WEA (Wireless Emergency Alerts) are enabled on your phone, and get the Alabama Weather Network app for your phone, TV, and tablet.
*Know the safe place in your home (small room, lowest floor, away from windows, in the middle of the house), and in that place have helmets for everyone in the family. This includes adults.
*If you live in a mobile home, know the location of the nearest shelter, or 24/7 business that can serve as a shelter. Have transportation arranged on severe weather days.
The Alabama Weather Network is a game changer. We take care of the entire state of Alabama with aggressive but appropriate long form coverage anytime a tornado warning is issued. It doesn't matter where you live, what TV market you are in, or what NWS office issues your warnings. We've got you covered with people and resources far beyond any other source.
Let's work together to prevent loss of life this tornado season in Alabama. We can do it.

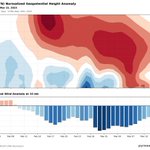
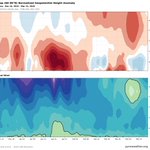
Time-height charts showing height anomaly (top) and U-winds (bottom). This is a sudden stratospheric warming event from March 4-March 10, 2026, as seen by the U-winds turning East @ 10-1mb, and (oc), stratospheric warming at the same time period.
#polarvortex #sswe #climate


Great looking 4 panel graphic!!

🌐🚨❄️ #Headsup February 2027:
Another Potential Major Polar Sudden Stratospheric Warming SSW event is possible for February-2027?
⛔️Firstly, this is an interim probabilistic forecast for February.
Could February 2027 feature a significant disruption of the Arctic stratospheric polar vortex, with potential downstream consequences for Northern Hemisphere circulation?
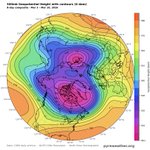
My latest analysis using the @PyReWeather 4-map interface identifies a potentially noteworthy configuration across the stratosphere and troposphere for February.
The assessment is based on a 20-member February structural analog composite, including February 1958, February 1983, and 18 additional analogs, with anomalies calculated relative to the 1991–2020 February climatology.
Here is what the four diagnostic maps reveal.
🌡️ 1. The 10hPa atmospheric temperature: pronounced Arctic stratospheric warming anomalies
The temperature composite displays substantial positive anomalies over the central Arctic , with the strongest warming signal extending toward the North American Arctic. This asymmetric warming pattern is consistent with a potentially disturbed polar vortex and raises the possibility of vortex displacement or deformation.
🌀 2. 10 hPa winds: a pronounced, asymmetric circulation anomaly
The updated 10 hPa wind-vector anomaly map adds an important diagnostic dimension. It shows a strong, spatially asymmetric ring of wind-anomaly magnitudes around the Arctic vortex, with marked variations in the circulation pattern with partial wind reversal (east-west flow) over the Eurasian sector. Combined with the pronounced temperature anomalies, this strengthens the case for monitoring a potential disruption of the polar vortex associated with a SSW possible event that may materialize during February weeks.
🌪️ 3. 300 hPa winds: pronounced upper-level circulation variability.
The 300 hPa wind-anomaly magnitude and vector field reveal substantial meridional variability and several distinct sectors of enhanced wind anomalies around the Northern Hemisphere.
This pattern suggests a potentially amplified upper-tropospheric circulation, with possible implications for jet-stream positioning, trough development, and the distribution of storm tracks. The anomaly magnitudes, however, should not be interpreted as actual wind speeds or as proof of a particular blocking regime.
🌐 4. The 500 hPa geopotential heights: an amplified planetary-wave pattern
The 500 hPa composite displays a pronounced wave pattern, with positive geopotential-height anomalies over parts of the Arctic sector and substantial negative anomalies across other high-latitude regions.
This configuration raises the possibility of high-latitude blocking and amplified troughing. Greenland blocking and ridging near the Urals are circulation features worth monitoring as the forecast window approaches, although their persistence and exact positions require further verification.
🌍 POTENTIAL DOWNSTREAM IMPLICATIONS FOR FEBRUARY 2027
If this stratospheric signal develops and couples with the tropospheric circulation, several regions deserve attention:
🌧️ North Atlantic and western Europe: potentially enhanced storm-track variability and episodes of unsettled weather.
❄️ Mediterranean and the Levant: opportunities for trough penetration, colder-air intrusions, and precipitation episodes, depending on the eventual synoptic configuration.
🌨️ North America: possible changes in the placement of troughs and ridges, including across parts of the S. United States and the North Pacific sector.
🧭 Northern Hemisphere circulation indices:
A negative NAO, Negative PNA, and negative EAWR and SCAND phases are potential configurations that may materialized to gather or independently across weeks of February.
📌 MY CURRENT ASSESSMENT
The 20-member February analog composite presents a potentially interesting SSW-related signal, supported by three notable features:
• Pronounced positive 10 hPa temperature anomalies over the Arctic.
• Strong, asymmetric 10 hPa wind-vector anomalies indicating a potentially disturbed stratospheric circulation.
• An amplified 500 hPa geopotential-height pattern accompanied by substantial 300 hPa wind anomalies.
Together, these features justify an early monitoring alert for a possible February 2027 stratospheric warming event.
The next critical step is to examine the daily evolution of the 10 hPa zonal-mean zonal wind at 60°N, alongside polar-cap temperature and geopotential-height anomalies, to determine whether the vortex merely weakens or undergoes a genuine major SSW And identify which weeks of February the major events may materialize.
Bottom line: February 2027 is worth watching for a possible major stratospheric warming. This is a probabilistic, analog-based forecast signal—not a declaration that an SSW, wind reversal, or specific regional weather outcome is certain.
Long-range analogs help identify plausible atmospheric regimes. The coming weeks and months of dynamical ensemble forecasts will be essential for determining whether this signal strengthens, weakens, or fails to materialize.
Statistical Model By Mr. M @Statisticizer.
#SSW #PolarVortex #StratosphericWarming #SeasonalForecast #WeatherAnalogues #PyReWeather #February2027

PyRe Weather retweeted

🌍🌀 Another successfully anticipated, unusual Polar Vortex Sudden Stratospheric Warming (SSW) event for November!
This event is unusual and relatively rare, and its potential occurrence has been on my forecast radar since June 2026—four months in advance. My approach integrates climatic teleconnection indices, the Arctic Oscillation (AO), the Quasi-Biennial Oscillation (QBO), and, most importantly, space-weather indices, examined under a Granger-causality framework with permissive model-misspecification assumptions.
I hope this achievement will not be mistaken for bragging. Since the late-November 2025 SSW, I have anticipated five such events successfully in a row. At this point, the real reward is not the adrenaline of another successful forecast; it is the opportunity to demonstrate what long-range statistical forecasting may be able to achieve.
🎯 The real message for scientists, climatologists, and weather enthusiasts is this:
The popular claim that weather cannot be predicted beyond five days is an oversimplification. Although conventional deterministic weather forecasts face rapidly increasing uncertainty with lead time, this does not mean that all aspects of the atmosphere become unpredictable beyond that horizon.
The climate system has memory. Its atmosphere, oceans, stratosphere, solar-related variability, and other interacting components can preserve signals that help identify recurring patterns and probabilistic tendencies months ahead. ENSO binary paradigm and super-elnino is a total oversimplification, the universe of atmospheric phenomena has black, white and degrees of white and grey in between, neglecting the grey is what makes those deterministic models fail with fanned out margin of error across time.
The key is understanding which signals matter, how they interact, and under what conditions previously observed physical patterns may recur or reoccur.
Long-range forecasting is not about claiming certainty. It is about extracting predictive information from the climate system that conventional approaches may overlook.
🌀 The challenge is not simply to predict tomorrow’s weather, but to recognize tomorrow’s atmospheric possibilities months before they emerge.
#ClimateScience #WeatherForecasting #SSW #PolarVortex #StratosphericWarming #Teleconnections #SpaceWeather #LongRangeForecasting #StatisticalForecasting
@judah47 @severeweatherEU @Recretos

❄️🌀🌎 Early November 2026 — Stratospheric Warming Signal
Early-November Polar Sudden Stratospheric Warming (SSW) Signal | 3–10 November 2026
The latest structural-analog analysis is showing a notable increase in the likelihood of a possible early-November sudden stratospheric warming episode during 3–10 November 2026, with the signal particularly pronounced across the Eurasian and North American sectors. This early November SSW had also oddly materialized in November 2025, which is considered a rare event .
The forecast is based on 20 candidate structural analogs for November 2026, with the resulting pattern remaining robust after resampling across 10 independent random-season ensembles.
The 10-hPa temperature composite shows a pronounced positive temperature anomaly across the Arctic/polar stratosphere, with the strongest warming extending through the Eurasian and North American sectors.
The accompanying 100-hPa vector-wind composite also indicates a highly disturbed circulation pattern around the polar region, providing additional evidence of an anomalous large-scale dynamical configuration during the same period.
⚠️ Important: This is not a confirmation of an SSW event. At this stage, it represents an analog-based probabilistic signal. Confirmation would require the dynamical evolution to produce the characteristic weakening and/or reversal of the 10-hPa polar-night jet, particularly in the zonal-mean winds near 60°N.
The next level of verification is therefore to examine the 10-, 30-, 50-, and 100-hPa circulation structure, including the evolution of the polar vortex and the potential role of upward-propagating planetary wave-1 and wave-2 activity.
If the temperature and wind signals remain dynamically coherent as we approach November, the case for an early-November stratospheric disruption becomes considerably stronger.
🔹 Forecast window: 3–10 November 2026
🔹 Method: Structural Analog Modeling + Random-Season Resampling
🔹 Candidate analogs: 20
🔹 Validation: 10 independent random-season ensembles
🔹 Primary diagnostic: 10-hPa polar temperature
🔹 Dynamical support: 100-hPa vector-wind structure
See the previous forecast for Nov SSW signal found from June in the comments please .
Statistical Model by @Statisticizer
🔋Powered by Aviatech Jordan & UAE-Dubai — Poultry Farm Equipment & Integrated Farming Solutions
Aviatech Jordan
aviatech-mena.com/allservice…


PyRe Weather retweeted

▶️ DE NO CREER | 🌊😳
⛈️ Gigantescas olas azotan las costas de Taiwán debido al avance del tifón Champi.
Las autoridades ya reportaron un fallecido y miles de evacuados a raíz del fenómeno. 🌀
PyRe Weather retweeted

Pagosa Springs, Colorado from the San Juan River is flooding. Prayers to all in its path that does not look good.
PyRe Weather retweeted
🌍🌦️General SYNOPTIC SETUP | LATE-OCTOBER ANALOG COMPOSITE 🌧️🌀
Using 20-analog ensemble for October final decade ( 21-31 October) by employing the interesting @pyreweather new 4-map analysis the following atmospheric synoptic patterns emerged:
🔹 UPPER-LEVEL CIRCULATION — 500 hPa 🌪️
A broad upper-level trough dominates the Eastern Mediterranean, Red Sea corridor, and Arabian Peninsula.
Negative geopotential height anomalies of −1 to −2 standard deviations extend from Western Asia into North Africa and the Arabian Gulf. The Red sea Trough (RST) is prominent with deepest distribution centered North Saudi Arabia.
🔹 JET STREAM & UPPER-LEVEL DYNAMICS — 300 hPa 💨🌀
A pronounced anomalous Easterly African Jet (AEJ) extends from Sub-Saharan Africa into southern Arabia (10°–15°N), while strong southwesterly wind anomalies stretch across central and eastern Arabia toward Iran . These dynamics may help organize moisture transport and convective activity. 🌬️🌧️
🔹 LOWER-LEVEL THERMAL PATTERN — 850 hPa ❄️🌡️
Widespread negative temperature anomalies of −1 to −3 standard deviations cover Western Asia, the Arabian Peninsula, and the Red Sea basin. Cooler air interacting with warmer, moisture-rich tropical air from the Arabian Sea and Gulf of Aden may enhance atmospheric instability.
🌧️🌍 PRIMARY RAINFALL SIGNALS & REGIONAL IMPRINTS
🇬🇷🇹🇷 1️⃣ EASTERN MEDITERRANEAN & AEGEAN SEA 🌊🌧️
Positive precipitation anomalies extend across Greece, the Aegean, parts of coastal Turkey, and the Levantine coast. Upper-level troughing combined with Mediterranean moisture availability may favor periods of enhanced rainfall. 🌀🌧️
🇾🇪🏝️🇴🇲 2️⃣ GULF OF ADEN, SOCOTRA & SOUTHERN ARABIA 🌊⛈️
The strongest positive rainfall anomalies, are concentrated around Central meditteranean and the Gulf of Aden, Socotra, eastern Yemen, and southern westtern Oman. Enhanced tropical moisture transport and favorable upper-level dynamics suggest increased convective potential.
3️⃣ A secondary rainfall signal of appears over northern Iraq, Southeast Turkey, and Northwestern Iran, western Morocco and Iberia southwestern sides.
Moisture advection from the Gulf interacting with upper-level disturbances may support localized rainfall and thunderstorms. 🌊🌩️
🔮📊 PROBABILISTIC OUTLOOK | OCTOBER 21–31
The late-October analog composite highlights three corridors of enhanced precipitation potential:
🌧️ Eastern Mediterranean and Aegean basin
⛈️ Gulf of Aden, Socotra, eastern Yemen, and southernwestern Oman, Nprth Iraq, northern Persia, and southeast Turkiye.
⚠️ These are standardized anomalies within the analog composite, not direct probabilities of rainfall occurrence or severity.
Actual outcomes will depend on the evolution of the synoptic pattern, moisture availability, and the positioning of upper-level disturbances.
🛰️🌍 Analog patterns identify potential scenarios—not certainties. Continued monitoring of the evolving atmospheric configuration is essential.
#WeatherForecast #SynopticAnalysis #AnalogForecasting #EasternMediterranean #MiddleEastWeather #Oman #Yemen #Jordan #Iraq #Iran #RainfallAnomalies #AtmosphericDynamics 🌧️🌀

PyRe Weather retweeted

It amazes me how many people are supporting of my efforts with Pyre Weather.
My goal was just to make reanalysis intuitive and look good, on a modern web interface when the PSL site stopped updating #itkyk
If you try it out, please tag @pyreweather in the image!


New features… 4-up panels!!
Look for the grid on the header and add up to 24 maps in a tray…choose four and save the png like this one.
Keep making em!!
Show me what you create! #pyreweather @BevinsWx @SteveSeman

PyRe Weather retweeted

AI weather models see the world on a grid. One cell over the Alps says 24°C, but inside it, the peaks are 12°C and the valleys 36°C.
Big labs fix this by building bigger, higher-resolution models. We tried something cheaper.
Keep the global model, and train a small model on top that learns how mountains, valleys and coasts shape the local weather.
We trained it in 1 hour on a single GPU. It takes forecasts over France from ~28 km to 5.5 km, and gets closer to what weather stations actually measure, especially in the mountains.
You can read more about how we trained the model on our blog post: huggingface.co/blog/EmmaScha…
and try the model yourself on our demo space: huggingface.co/spaces/EmmaSc…
PyRe Weather retweeted

¡Situación angustiosa! Hoy he recibido este vídeo de una de las 13 personas que fueron rescatadas en la noche del pasado lunes (19/10/2026) en los túneles de la AP-7 a su paso por #PilarDeLaHoradada (#Alicante) tras anegarse por la #lluvia. Tremendo, recuerdo imborrable, ¡ánimo!
PyRe Weather retweeted

Unwarned significant tornado ongoing with a debris ball near San Mateo, New Mexico.

Two new features to announce at pyreweather.org!
1) gray landfill to help with better figure / ground. this is optional and you can turn it on or off in user settings
2) streamlines as a wind option! You can choose from streamlines, barbs an vectors now.


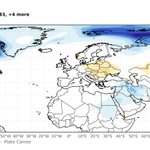
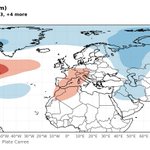
This map was made using pyreweather.org, showing a 23 month composite from la niña winter months, and the associated snowfall depth in europe.

