

astrophysics - tx
United States
Joined October 2025
- Tweets2K
- Following510
- Followers11.6K
- Likes5.1K




Pinned Tweet
Early voting is live. (link below)
Every Texas precinct, day by day, as counties post their voters.
See who has voted so far by their primary record: last voted in a Democratic primary, a Republican primary, or none, and in how many of the last four.
Compare it with every general since 2020, split by mail, early in person and election day, and see how each group’s primary record lined up with the actual result.

We got about 100k votes in for Day 3.
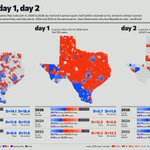
This map visualizes primary voters.
There will be still some counties reporting for Day 2.
Here is how they look, turnout is gradually decreasing compared to 2024 and Republicans are improving.
I want to warn, until we get the full picture, everyone should be cautious about making deceive predictions.
We still need more data to interpret these results to a final result.

Theo retweeted

TX IPEV IMPORTANT COUNTIES:
Day 2 was good for Dems, though significantly less so than Day 1. In 16 counties representative of the state, the implied 2024 partisanship is still well-left of where the first two days of EV were 2 years ago. If I had all of the remaining 238 counties the recalled vote would probably be something like Trump +6 (8 point shift left from 2024).
Best points for Dems: Hispanic voters (Hidalgo, Cameron)
Worst points for Dems: non-college whites (Hardin, Randall) are barely budging. But... their turnout is terrible so far.
Lots of non-voters that are skewing young/nonwhite.
White voters are really punching below their weight even in urban areas.
Indians in Collin/Fort Bend are possibly beginning to pop off in turnout/bluer recall.
More updates will be made - but here is where we are in day 2 of IPEV.
Interactive here:
claude.ai/artifact/QSaAiFYUj…


Theo retweeted

For Texas stuff
-@theoelections
-@_fat_ugly_rat_
-@DjsokeSpeaking
-@Birenbomb
-@scottbraddock
-@kaylaguo_
@gromerjeffers

We now have 122 counties that has reported their Day 2 early in person numbers, up from 88.
These maps visualizes primary voters.
Day 1 / Day 2
D - 39.7% / 39.1%
R - 34.0% / 30.9%
NP - 26.3% / 30.0%
As expected, the share of non-primary voters is growing and will continue to grow.
I will update this map as soon as we get more counties.


We have 88 counties in for Day 2.
These maps visualizes primary voters.
For the 88 counties that reported:
Day 1 / Day 2
D+11.6 / D+7.2
Total Democratic primary voter swing went from 23.8 points to 19.4 points.
Democratic primary voters still hold a commanding swing but Republican primary voters improved compared to the first day.


Theo retweeted

Make sure you follow @theoelections. Great data and he is killing it on his graphs.

We have 88 counties in for Day 2.
These maps visualizes primary voters.
For the 88 counties that reported:
Day 1 / Day 2
D+11.6 / D+7.2
Total Democratic primary voter swing went from 23.8 points to 19.4 points.
Democratic primary voters still hold a commanding swing but Republican primary voters improved compared to the first day.

DFW Metro has also started pretty strong for Democrats for the first in person early voting day.

Day 1 of EV in Texas: (updated)
We now have 242 of 254 counties in for the first day of early voting (99.6% of the 2024 vote).
This map shows voters by the primaries they took part in, 2020 to 2026.
Voters with only Democratic primaries lead those with only Republican primaries by 7.8 points, a 16.6-point swing from the first day of 2024.
There are 10 days of early voting left and then Election Day, and I’ll keep reporting as the numbers change.

Theo retweeted

On that note, go follow @theoelections, of course along with our incredible fellows @ryanjmccomb, @ElliscbIV, @JordanSchwartz, and @juanfwulff at VoteHub.
Students who take their classes really seriously, and spend their free time hard at work doing cool elections stuff!
Theo retweeted
Theo is doing an awesome job with Texas data collection, and finds a much more blue day one election by primary voting history. He deserves a follow!
xitter.cf/theoelections/status/2…