

Independent Research 🧐 | Quantum/Condensed Matter Physics ⚛️| ZPF Engineering 🛰| Inventor/Futurist 🛠| AVD (Applied Vacuum Dynamics) Founder, QVC and TDVT
- Tweets1.1K
- Following308
- Followers568
- Likes3K
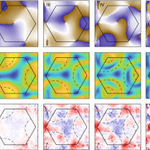








ALT Three hexagonal density plots show the electron density (r) of a fractional Chern insulator ground state within a moiré unit cell, The top plot shows a central circular high-density region surrounded by a uniform blue ring inside a hexagon. The bottom left plot has distinct dark-blue density spots arranged in a hexagonal lattice. The bottom right plot shows more concentrated density spots, indicating stronger spatial modulation.

ALT Scientific figure. Panel (a) shows a simple model of the vortex-tangle decay over time, proceeding from left to right as a series of four cylindrical containers. The containers represent the geometry of the paper’s optical box trap, with purple dots and lines visualizing the quantum turbulence, which gradually dissipates over time. Panel (b) displays a schematic of the paper’s experimental setup. On the left, a small cylinder represents the optical box trap from panel (a). The next step magnifies the cylinder, and shows the taking of a “slice” visualized by an orange rectangle running through the middle. This slice produces the experimental observations, shown on the right as 2D images of the quantum turbulence as well as a numerical simulation. The images are labelled with a color scale bar, ranging from dark blue for the lowest values to white for the highest values.


ALT A metallic ice cube sits in the center of a swirling, vibrant purple liquid surface, creating ripple effects around it.


ALT Side view of a white and blue NASA aircraft (tail number N606NA) on a paved runway taxiway under a clear sky. Credit: NASA

ALT Three NASA team members inside a communications operations room monitoring real-time flight tracking software, maps, and system telemetry across multiple computer screens and rack-mounted server hardware next to an open exterior doorway. Credit: NASA

ALT Optical tracking and laser communication equipment set up on an outdoor rooftop platform under a clear blue sky, and a blue hydraulic scissor lift cart supporting additional sensors and electronic control hardware. Credit: NASA
